Quickie: Jay Bruce is off to a very wonkish start. April 14, 2017
Posted by tomflesher in Baseball.Tags: Jay Bruce
add a comment
In an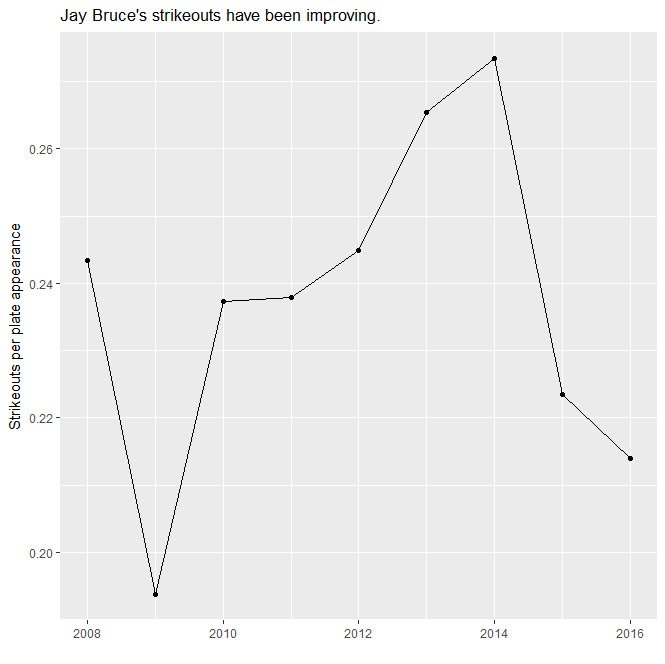 earlier post, I noted that Jay Bruce would have been expected to accumulate about .0838 walks per plate appearance (whether that’s estimated using a linear time trend or a quadratic one). It’s interesting to note that Bruce hasn’t merely hit more home runs and taken more walks so far, he’s also struck out significantly less.
Using R, I simulated 1,000,000 46-plate-appearance streaks, using a binomial trial system (simulating only “struck out” or “didn’t strike out” as outcomes). Choosing what rate to use for Bruce’s expected rate of strikeouts per plate appearance (K/PA) was a challenge. Last season, he had a historically low K/PA rate of .2139 (one strikeout ever 4 2/3 plate appearances) – bested only by his 2009 season (.1938). His rate with just the Reds was .2065 and his rate with just the Mets was .2299. Estimating a time trend was difficult because Bruce has fluctuated quite a bit, yielding .2429 for a linear model and .207 for a quadratic model. His total strikeouts through the end of 2016 (1239) divided by his total plate appearances (5189) give a rate of .2388. A simple average of his yearly K/PA numbers gives .237.
 Since the condition I’m testing is whether Bruce has improved markedly, I’ll take the logical measure that contains the most likely bias – that is, I’m going to take a low one. I went with his .2139 mark from last year, since it combines his likely unusual rate with the Reds with a more reasonable, but still good, rate with the Mets. (I know, it’s wild that he was more disciplined than he’d been most of his career during the time he was being crucified in the media, but so it was.)
Those 1,000,000 streaks of Bruce’s 46 plate appearances yielded a distribution clustered around 9 and 10 strikeouts. The mean was 9.841 and the median was 10. About 28% of the distribution was contained in the 9- and 10-strikeout blocks. As for his actual number, Bruce has only struck out 4 times. The likelihood he’d have 4 or fewer strikeouts at this point is only about .02, meaning it happened about 2% of the time. That figure would be even smaller if we assumed a higher rate of strikeouts.
When strikeouts decrease at the same time walks increase, there are a few possibilities. It could be that the small sample size is emphasizing Bruce facing worse pitchers than usual, or umpires who are more batter-friendly than usual. Ruling out those possibilities would simply require examining how the rest of the Mets are faring compared with previous years. It’s also possible Bruce is simply on a hot streak and will cool down to his expected levels soon. Nevertheless, he’s been batting smart this year, including finally bunting through a shift last night in a crucial play to come back from an early deficit.
Quickie: Jay Bruce’s Walks April 10, 2017
Posted by tomflesher in Baseball.Tags: Jay Bruce
add a comment
In an earlier post, I ran a quick regression (with very few datapoints) to determine that Jay Bruce‘s expected walks per plate appearance this year should be about .0838. In other words, he should walk once every 12 or so plate appearances.
So far (before the Mets’ 7th game of the season), Bruce has walked 5 times in 25 plate appearances, a .20 rate. That’s more reasonable than his .31 rate entering the weekend, but he still walked once in 12 plate appearances. How unlikely is that? I fired up R and ran a simulation of 50,000 25-plate-appearance streaks, modeling them as binomial trials – in other words, I’m simulating only the outcomes “Walked” or “Didn’t walk.” The graph:
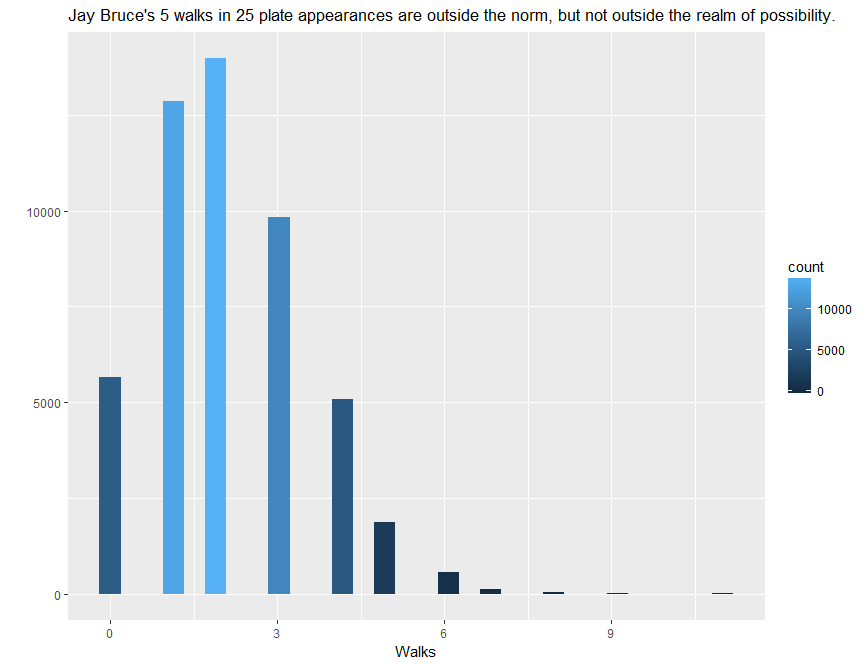 Bruce’s 5 walks are unlikely – the probability that he’d have below 5 is .947. Exactly 5 would happen with probability of about .038. It’s not completely unheard of that Bruce would be at his expected level and have a streak of luck at the beginning of the year. However, it’s likely that Bruce has been spending extra time in the batting cages and has been working on his plate discipline.
Mets Game 3 Commentary: Jay Bruce Continues To Surprise April 7, 2017
Posted by tomflesher in Baseball.Tags: Jay Bruce, Mets game 3
add a comment

Jay Bruce in August 2016. Photo: Editosaurus via Wikimedia Commons.
Before yesterday’s game, I speculated that Jay Bruce might be a good bet to sit against a left-handed starter, even suggesting Ty Kelly would make a good stopgap corner fielder due to Kelly’s strong numbers against lefties. Nevertheless, Bruce started the game and Kelly saw no action – by the time a pinch hitter was needed, right-hander Chaz Roe was in and lefty Michael Conforto was the clear choice off the bench.
Last year, Terry Collins wasn’t happy with Bruce, famously allowing Eric Campbell to pinch hit for him in the September stretch run. It’s clear that Bruce has regained Collins’ favor, since he started against a left-hander last night and has performed well. However, he didn’t perform especially well against Jaime Garcia, as his fifth-inning walk was his only time on base last night.
While it’s a bit early to rest a starting outfielder, Ty Kelly has fantastic numbers against left-handed pitching and I’d like to see him get more chances to demonstrate whether he’s been lucky or really has a read on the pitching. Playing Kelly would have still left righty infielder T.J. Rivera and righty backup catcher Rene Rivera – no relation – ready to come up in a pinch. Bruce’s defense has been decent; he logged two putouts and no errors last night. Still, Collins is showing confidence in Bruce, who many speculated wouldn’t even be a Met on opening day.

Jay Bruce’s yearly walk and OBP numbers before this season.
Bruce has seen a recent uptick in his on-base percentage, famously a crucial measure of contribution to the team. Currently, he’s sitting on an OBP of .538, driven in large part by 4 walks in 13 plate appearances. At .31 walks per plate appearance, he’s nearly triple his highest previous career season (.11) and over tripled his career mark (.09). He’s unlikely to sustain this; however, his OBP has climbed the past two seasons from a historical low of .281 in 2014 to a so-so .309 in 2016. It’s possible that Bruce is showing an early hot streak that is, nonetheless, a sign of growth at the plate.
If Bruce were following a normal trend, we’d expect him to be at about .0838 walks per plate appearance. As noted, he’s at .31. In any 100 streaks of 13 plate appearances, he should be somewhere between .00 and .25 95 times. Although this is a very small sample size, it’s likely that Bruce has made some changes in his approach at the plate, especially since those walks haven’t been intentional.
I’ve included a line chart of Bruce’s season walks and OBP over his time in the majors.
