Why isn’t baseball’s free agent market clearing? February 21, 2019
Posted by tomflesher in Baseball, Economics.Tags: Baseball, economics, microeconomics, sabermetrics, sports economics, winner's curse
add a comment
There’s been some discussion of the free agent market in baseball and its alleged inefficiency – that players like Manny Machado don’t sign until February and Bryce Harper is still unsigned, for example. Adam Wainwright, for example, has threatened a strike over free agency.
Certainly, there are many factors in play. However, the fact that there are stars who aren’t being picked up doesn’t mean that there’s anything nefarious afoot. Brad Brach, who signed with the Cubs on February 11, has complained about the teams’ use of algorithms to value players:
Brad Brach on his free-agency experience: “We talked to certain teams and they told us that, ‘We have an algorithm and here’s where you fall.’ … It’s just kind of weird that all offers are the same, they come around the same time. Everybody tells you there’s an algorithm.”
— Jordan Bastian (@MLBastian) February 15, 2019
https://platform.twitter.com/widgets.js
Let’s take that at face value and build a model of algorithms and noise. (It seems that Brach is implying collusion by teams, but in a future post I’ll discuss why I don’t think that’s likely.)
First, the simplifying assumptions:
- Players have an accurate valuation of their own talent levels (This is difficult to justify because players have an incentive to overvalue themselves, but the conclusions would not change qualitatively by relaxing this assumption)
- Teams have a noisy valuation of players based on the players’ talent levels (This is essentially the face value Brach’s claim: that teams use ‘algorithms’ based on player talent.)
- There are two teams with similar noise levels. (Modeling different forms of bias, or different preferences by teams, would probably not change the outcome very much, but would affect the distribution of players. Meanwhile, the market for some players is fairly large, but for many it’s very small, especially as prices rise.)
- All contracts are for one year. (This avoids the trouble of modeling players’ intertemporal rates of substitution, but a future version of this model may include preferences about both pay and number of years.)
- If a player is offered a contract that he thinks accurately reflects or overpays him, he signs with the team that offers him the bigger contract.
Poorly-constructed R code for a simulated free agent season:
data<-matrix(1:5000,nrow=1000,ncol=5)

for (i in c(1:1000)){data[i,1] <- runif(1)

data[i,2] <- data[i,1]+rnorm(1,mean=0,sd=.05)

data[i,3] <- data[i,1]+rnorm(1,mean=0,sd=.1)

data[i,4] <- max(data[i,2],data[i,3])

data[i,5] <- if(data[i,4]>=data[i,1]) data[i,5]=1 else data[i,5]=0}
Basically, generate a vector of random player talent levels; team 1 accurately values players with a standard deviation of .05, while team 2 accurately values them with a standard deviation of .1. 1000 players go on the market. Outcome:
| V1 | V2 | V3 | V4 | V5 |
| Min. :0.0008885 | Min. : -0.1324 | Min. : -0.2024 | Min. : -0.1324 | Min. :0.000 |
| 1st Qu.:0.2613380 | 1st Qu.: 0.2621 | 1st Qu.: 0.2608 | 1st Qu.: 0.3012 | 1st Qu.:1.000 |
| Median :0.4984726 | Median : 0.4968 | Median : 0.5133 | Median : 0.5511 | Median :1.000 |
| Mean :0.4997539 | Mean : 0.4987 | Mean : 0.5087 | Mean : 0.548 | Mean :0.754 |
| 3rd Qu.:0.7425434 | 3rd Qu.: 0.743 | 3rd Qu.: 0.7566 | 3rd Qu.: 0.7912 | 3rd Qu.:1.000 |
| Max. :0.9995596 | Max. : 1.1115 | Max. : 1.2508 | Max. : 1.2508 | Max. :1.000 |
That’s right – only 754 of the 1000 players signed. (In multiple simulations, the signing rate hovers around 75%. This makes sense theoretically, since valuations are independent: half the players will be undervalued by each team so 1/4 will be undervalued by both teams.)
Interestingly, player 973 is unsigned:
[973,] 0.9683805341 0.9472948838 0.874961530 0.9472948838 0
He evaluated himself at below the 97th percentile, but got unlucky in that both teams evaluated him below that: team 1 would offer him a 95th percentile contract and team 2 would rank him even further down.
Meanwhile, player 25 gets lucky:
[25,] 0.0109281745 0.0236191242 0.089982324 0.0899823237 1
Despite being in the 1st percentile, both teams accidentally overvalue him, and his contract ends up being suited to a player with nearly 9 times his value. (For the phenomenon where competition leads reliably to overpayment, see “winner’s curse.”)
We’re going to see both of these types of errors in any market where there’s a subjective evaluation of players. Particularly if the teams are using algorithmic valuations, much of the information they’re based on is going to be publicly available; even if teams weight it differently, efficient algorithms are likely to produce similar results.
Matt Harvey DFA’d. What does that mean? May 4, 2018
Posted by tomflesher in Baseball, Sports.Tags: Matt Harvey, Mets, The Dark Knight, The Rise And Fall, transactions
1 comment so far
Mets mopup reliever Matt Harvey was asked by the team to accept an assignment to the AAA Las Vegas 51s. Harvey refused, so the team will designate him for assignment, or “DFA” him. Here are some big questions that might arise from that move.
First and foremost, why did the team ask Harvey to accept a demotion? Because they needed to. The Mets don’t have the right to send Harvey down on their own volition like they do with other players. Hansel Robles, for example, was optioned to the minors earlier this year, and the Mets were not required to ask his permission because Robles had less than five years of service time and had only been shuttled between the majors and the minors in two prior years. New players have three “option years”: as long as they have less than five years of service time, players can be down to the minors and called back up by the team without having to get the consent of the player. Robles is in his third option year, since the team used options in 2015 and 2017, as well as this year. Steven Matz has never been optioned to the minors, so the Mets could sent him to AAA at will. Harvey, then, would have all three option years left, since he hasn’t been sent down to the minors since debuting in 2012. However, he has over five years of service time. As a result, he can exercise what’s called “veteran’s consent,” meaning the team cannot send him down without his permission or without jumping through some hoops first.
What hoops? In order to send Harvey down, they have to first change his status to “designated for assignment.” That means he comes off both the 25-man (active) and 40-man (extended) rosters. The 25-man roster comprises all the players eligible to play in a game today for the team; the 40-man roster includes players who the team can call up, if they have room on the active roster. Sending Harvey to the minors removes him from the 25-man roster automatically, but had he consented to an assignment to Vegas, he would have remained on the 40-man roster. By DFAing him, the Mets open a spot on both the active and 40-man rosters and place Harvey in a kind of limbo for up to 10 days.
What can the Mets do now? Conceivably, the Mets could immediately release Harvey. They would remain on the hook for his entire $5,625,000 salary for 2018. Harvey would be free to sign with any other team. If he did, any salary paid to him would reduce the Mets’ liability, so these signings are generally at the league minimum. The Mets took advantage of this rule, for example, when they signedGary Sheffield.
More likely, the Mets will put Harvey on waivers. That means that all teams will be informed that Harvey is available and be able to “claim” him for themselves. If multiple teams claim him, the team with the worst record will have priority. The Mets could just let a team claim him, or they could try to work out a trade with one of the teams that shows interest. They could also, on seeing interest in Harvey, revoke the waivers and put him back on the 40-man roster.
If Harvey clears waivers (meaning no team claims him), the Mets then have the ability to send Harvey to the minors. This is called “outrighting” him, for “sending him outright to the minors,” and can only happen to a player once in his career without his consent.
Wow. So what will happen? The Mets won’t likely release Harvey right away. That precludes the chance to arrange a trade and get something out of this situation.
There won’t likely be much trading interest in Harvey. He’s had a difficult year. After returning from injury in September of last year, he put up an 11.28 ERA in 22 1/3 innings across 5 starts. (Really, it was 6, since his game in relief was simply piggybacking on a well-publicized one-inning start by Noah Syndergaard.) There was hope he’d come back in better condition this year, but his first four starts came out to a 6.00 ERA with opponents slashing .302/.337/.512. After his 0-2 start, he was moved to the bullpen against his will. In relief, he’s made four appearances spanning 6 innings and put up a 10.50 ERA with an opposing slash of .304/.414/.696. That’s with a luckier-than-average .263 BAbip, too. It’s possible some team would like to have Harvey, but he’s more likely to end up being sent to the minors.
Harvey hasn’t handled the trip to the bullpen very well, so it’s likely he won’t handle Vegas well, either. He may end up staying in Vegas, or the Mets may find a trade partner. Best case scenario, he sees this as a chance to get his act together and takes advantage of 51s pitching coach Glenn Abbott. Alternatively, he may end up playing for the Long Island Ducks with former Mets Francisco Rodriguez and Jordany Valdespin.
He’s baaaaaaaaack. April 11, 2018
Posted by tomflesher in Baseball, Sports.Tags: gratuitous Hansel Robles, Hansel Robles
add a comment
Yes, we’re talking about Hansel Robles.
Robles struggled through spring training; his statistics last y
ear were inconsistent at best. In a 7-5 season, he put up a 4.92 ERA with opponents slashing .226/.332/.418. Nevertheless, he had flashes of adequacy: in July, he went 2-0 in 6 games with a 1.35 ERA over 6 2/3 innings pitched, and although he was 1-4 with a blown save in August, he put up an acceptable 2.81 ERA with an opposing slash line of .135/.308/.192. For a guy with a .52 GB/FB ratio and a reputation as serving up homers, going a month and a half with only two home runs was quite an improvement.
In his small sample size this year, Hansel has shown a .22 GB/FB ratio – that is, the vast majority of the contact made results in fly balls, making him a liability within Citi Field. (Surprisingly, he had a .281 SLG against at home, compared with a .585 on the road – shocking considering Citi’s short fences.) Still, manager Mickey Callaway called him up when the team needed a reliever and has been using him somewhat regularly – Hansel is 2-0 with a 1.80 ERA in five games so far.
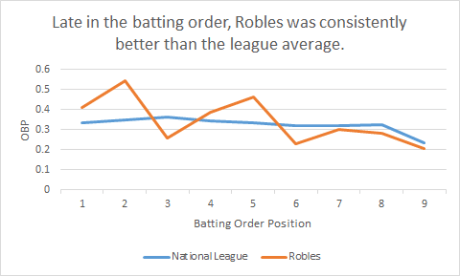
Choosing Hansel’s appearances carefully seems crucial: the graph above shows Hansel’s OBP-against by batting order position, compared with the league’s. Gary Cohen last night noted that Callaway seems to be bringing Hansel in primarily against the bottom of the order, and in fact in 2018 he was significantly more effective against hitters hitting sixth or later than the National League average.
2017: One last chance to question the official scorer. November 2, 2017
Posted by tomflesher in Baseball.add a comment
In game 7 of the 2017 World Series, neither starter lasted long. Yu Darvish left after only 1 2/3 innings, and Lance McCullers lasted only 2 1/3. Even though McCullers left with a 5-0 lead, that short start left him ineligible for the win. Behind the cut, I’ll examine the relevant rules for determining which pitcher should be credited with the win, and why I don’t agree with the official scorer’s decision to give Charlie Morton the win.
How has hitting changed this year? Evidence from the first half of 2017 August 22, 2017
Posted by tomflesher in Baseball.Tags: Baseball, binomial distribution, home runs, MLB, probability, Stuff Gary Cohen Says
3 comments
It’s no secret that MLB hitters are hitting more home runs this year. In June, USA Today’s Ted Berg called the uptick “so outrageous and so unprecedented” as to require additional examination, and he offered a “juiced” ball as a possibility (along with “juiced” players and statistical changes to players’ approaches). DJ Gallo noted a “strange ambivalence” toward the huge increase in home runs, and June set a record for the most home runs in a month. Neil Greenberg makes a convincing case that the number of homers is due to better understanding of the physics of hitting.
How big a shift are we talking about here? Well, take a look at the numbers from 2016’s first half. (That’s defined as games before the All-Star Game.) That comprises 32670 games and 101450 plate appearances. In that time period, hitters got on base at a .323 clip. About 65% of hits were singles, with 19.6% doubles, 2.09% triples, and 13.2% home runs. Home runs came in about 3.04% of plate appearances (3082 home runs in 101450 plate appearances).

Using 2016’s rate, 2017’s home run count is basically impossible.
Taking that rate as our prior, how different are this year’s numbers? For one, batters are getting on base only a little more – the league’s OBP is .324 – but hitting more extra-base hits every time. Only 63.7% of hits in the first year were singles, with 19.97% of hits landing as doubles, 1.78% triples, and 14.5% home runs. There were incidentally, more homers (3343) in fewer plate appeances (101269). Let’s assume for the moment that those numbers are significantly different from last year – that the statistical fluctuation isn’t due to weather, “dumb luck,” or anything else, but has to be due to some internal factor. There weren’t that many extra hits – again, OBP only increased by .001 – but the distribution of hits changed noticeably. Almost all of the “extra” hits went to the home run column, rather than more hits landing as singles or doubles.
In fact, there were more fly balls this year – the leaguewide grounder-to-flyer ratio fell from .83 in 2016 to .80 this year. That still doesn’t explain everything, though, since the percentage of fly balls that went out of the park rose from 9.2% to 10%. (Note that those are yearlong numbers, not first-half specific.) Not only are there more fly balls, but more of them are leaving the stadium as home runs. The number of fly balls on the infield has stayed steady at 12%, and although there are slightly more walks (8.6% this year versus 8.2% last year), the strikeout rate rose by about the same number (21.5% this year, 21.1% last year).
Using last year’s rate of 3082 homers per 101450 plate appearances, I simulated 100,000 seasons each consisting of 101269 plate appearances – the number of appearances made in the first half of 2017. To keep the code simple, I recorded only the number of home runs in each season. If the rates were the same, the numbers would be clustered around 3077. In fact, in those 100,000 seasons, the median and mean were both 3076, and the distribution shown above has a clear peak in that region. Note in the bottom right corner, the distribution’s tail basically disappears above 3300; in those 100,000 seasons, the most home runs recorded was 3340 – 3 fewer than this year’s numbers. In fact, the probability of having LESS than 3343 home runs is 0.9999992. If everything is the same as last year, the probability of this year’s home runs occurring simply by chance is .0000008, or roughly 8 in 10 million.
Quickie: Jay Bruce is off to a very wonkish start. April 14, 2017
Posted by tomflesher in Baseball.Tags: Jay Bruce
add a comment
In an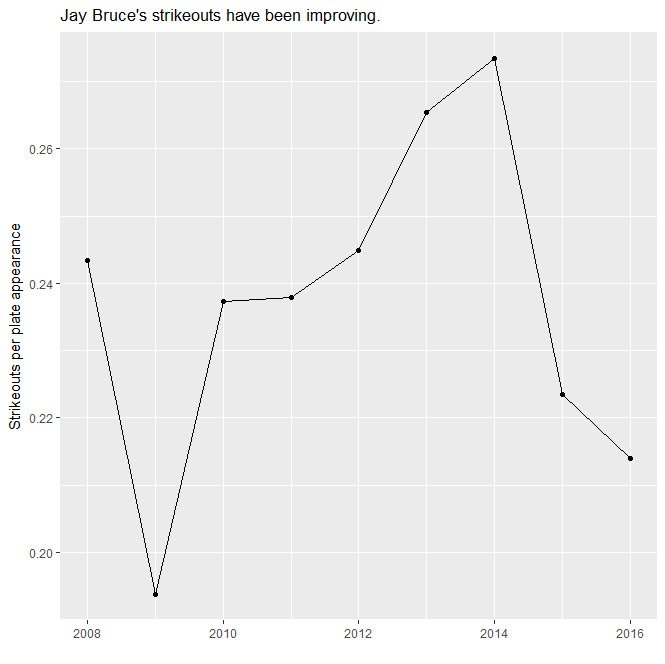 earlier post, I noted that Jay Bruce would have been expected to accumulate about .0838 walks per plate appearance (whether that’s estimated using a linear time trend or a quadratic one). It’s interesting to note that Bruce hasn’t merely hit more home runs and taken more walks so far, he’s also struck out significantly less.
Using R, I simulated 1,000,000 46-plate-appearance streaks, using a binomial trial system (simulating only “struck out” or “didn’t strike out” as outcomes). Choosing what rate to use for Bruce’s expected rate of strikeouts per plate appearance (K/PA) was a challenge. Last season, he had a historically low K/PA rate of .2139 (one strikeout ever 4 2/3 plate appearances) – bested only by his 2009 season (.1938). His rate with just the Reds was .2065 and his rate with just the Mets was .2299. Estimating a time trend was difficult because Bruce has fluctuated quite a bit, yielding .2429 for a linear model and .207 for a quadratic model. His total strikeouts through the end of 2016 (1239) divided by his total plate appearances (5189) give a rate of .2388. A simple average of his yearly K/PA numbers gives .237.
 Since the condition I’m testing is whether Bruce has improved markedly, I’ll take the logical measure that contains the most likely bias – that is, I’m going to take a low one. I went with his .2139 mark from last year, since it combines his likely unusual rate with the Reds with a more reasonable, but still good, rate with the Mets. (I know, it’s wild that he was more disciplined than he’d been most of his career during the time he was being crucified in the media, but so it was.)
Those 1,000,000 streaks of Bruce’s 46 plate appearances yielded a distribution clustered around 9 and 10 strikeouts. The mean was 9.841 and the median was 10. About 28% of the distribution was contained in the 9- and 10-strikeout blocks. As for his actual number, Bruce has only struck out 4 times. The likelihood he’d have 4 or fewer strikeouts at this point is only about .02, meaning it happened about 2% of the time. That figure would be even smaller if we assumed a higher rate of strikeouts.
When strikeouts decrease at the same time walks increase, there are a few possibilities. It could be that the small sample size is emphasizing Bruce facing worse pitchers than usual, or umpires who are more batter-friendly than usual. Ruling out those possibilities would simply require examining how the rest of the Mets are faring compared with previous years. It’s also possible Bruce is simply on a hot streak and will cool down to his expected levels soon. Nevertheless, he’s been batting smart this year, including finally bunting through a shift last night in a crucial play to come back from an early deficit.
Mets Game 10 Commentary: Won’t someone please think of the Bullpens! April 14, 2017
Posted by tomflesher in Baseball.Tags: bullpen usage, Marlins, Mets game 10
add a comment
In 16 innings, the Mets defeated the Marlins to extend their record to a division-leading 7-3. This is especially promising because the Mets went 1-2 in their first series against the Marlins last week, including losses to last night’s starter (Wei-Yin Chen) and losing pitcher (Adam Conley). Both teams depleted their bullpens, with the Mets using starter Jacob deGrom to pinch-hit and the Marlins using Conley, who started in all 25 of his appearances last year, as emergency relief. Neither team had any relievers left in the bullpen or any hitters left on the bench.
Surprisingly, neither team has made a roster move as of the time of writing. EDIT: The Mets called up lefty Sean Gilmartin several minutes after this posting. The Mets sent reliever Pat Sewald down before the game to make room for center fielder Juan Lagares, so Sewald wasn’t eligible to come back up, but New York had relied on Sewald and reliever Corey Taylor for saves in the spring. Taylor is pitching in Binghamton with an ugly 7.71 ERA in 2 1/3 innings over three appearances. Making a roster move would also rely on having a player to send down, but the bench is thick with players and few if any of the bullpen pitchers are expendable. However, Hansel Robles has pitched in four straight games and is undoubtedly unavailable tonight; Fernando Salas has pitched in two straight, and Addison Reed in three (2 innings last night). Meanwhile, Jerry Blevins has pitched in the last 2, totaling only 17 pitches. With three innings last night, Josh Smoker is likely to be unavailable, but Josh Edgin is well-rested despite a difficult appearance last night and a 4.15 ERA. Rafael Montero may make a second consecutive appearance tonight, although he’ll have all Mets fans biting their nails if he comes out of thrower jail. I’d be unsurprised to see Jacob deGrom make an appearance in relief, although it’s early in the season to play that game. (It’s times like this that I wish we still had Bartolo Colon.)
In a head-scratcher, the Marlins used a starter (Conley) while leaving reliever A.J. Ramos on the bench. Ramos had, as Marlin Maniac points out, pitched in the two previous games, tossing 2 innings and allowing one run. Every other bullpen pitcher pitched, including Brad Ziegler in his third straight game. Sadly, the bullpen seems to be well-rested enough that we won’t get to see Ichiro Suzuki pitch tonight.
Late in the game, I realized I don’t know who the Mets are likely to use in emergencies: Rene Rivera came in to play first base in a double switch in the 12th, so the backup catcher was in the game. Generally the emergency catcher would be a backup infielder, so T.J. Rivera would be the logical choice, but he’d come out of the game in a platoon maneuver to make room for Lucas Duda at first. Rivera or Jose Reyes might be a logical emergency pitcher, but it seems the new Blue Jay Ty Kelly might have filled in those positions. Judging by the state of the bullpen, we may find out tonight who Terry has slated to pitch in an emergency.
Quickie: Jay Bruce’s Walks April 10, 2017
Posted by tomflesher in Baseball.Tags: Jay Bruce
add a comment
In an earlier post, I ran a quick regression (with very few datapoints) to determine that Jay Bruce‘s expected walks per plate appearance this year should be about .0838. In other words, he should walk once every 12 or so plate appearances.
So far (before the Mets’ 7th game of the season), Bruce has walked 5 times in 25 plate appearances, a .20 rate. That’s more reasonable than his .31 rate entering the weekend, but he still walked once in 12 plate appearances. How unlikely is that? I fired up R and ran a simulation of 50,000 25-plate-appearance streaks, modeling them as binomial trials – in other words, I’m simulating only the outcomes “Walked” or “Didn’t walk.” The graph:
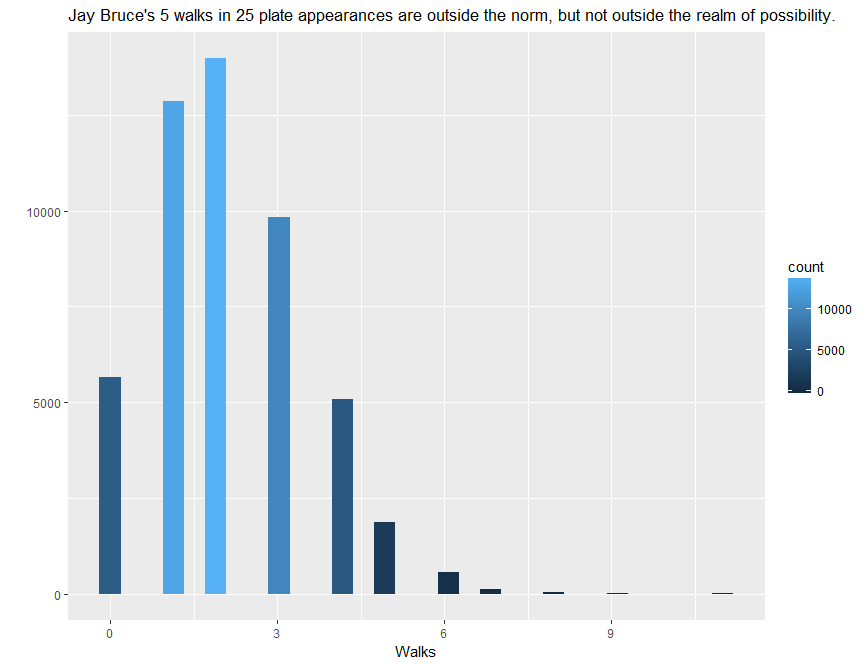 Bruce’s 5 walks are unlikely – the probability that he’d have below 5 is .947. Exactly 5 would happen with probability of about .038. It’s not completely unheard of that Bruce would be at his expected level and have a streak of luck at the beginning of the year. However, it’s likely that Bruce has been spending extra time in the batting cages and has been working on his plate discipline.
Mets Game 3 Commentary: Jay Bruce Continues To Surprise April 7, 2017
Posted by tomflesher in Baseball.Tags: Jay Bruce, Mets game 3
add a comment

Jay Bruce in August 2016. Photo: Editosaurus via Wikimedia Commons.
Before yesterday’s game, I speculated that Jay Bruce might be a good bet to sit against a left-handed starter, even suggesting Ty Kelly would make a good stopgap corner fielder due to Kelly’s strong numbers against lefties. Nevertheless, Bruce started the game and Kelly saw no action – by the time a pinch hitter was needed, right-hander Chaz Roe was in and lefty Michael Conforto was the clear choice off the bench.
Last year, Terry Collins wasn’t happy with Bruce, famously allowing Eric Campbell to pinch hit for him in the September stretch run. It’s clear that Bruce has regained Collins’ favor, since he started against a left-hander last night and has performed well. However, he didn’t perform especially well against Jaime Garcia, as his fifth-inning walk was his only time on base last night.
While it’s a bit early to rest a starting outfielder, Ty Kelly has fantastic numbers against left-handed pitching and I’d like to see him get more chances to demonstrate whether he’s been lucky or really has a read on the pitching. Playing Kelly would have still left righty infielder T.J. Rivera and righty backup catcher Rene Rivera – no relation – ready to come up in a pinch. Bruce’s defense has been decent; he logged two putouts and no errors last night. Still, Collins is showing confidence in Bruce, who many speculated wouldn’t even be a Met on opening day.

Jay Bruce’s yearly walk and OBP numbers before this season.
Bruce has seen a recent uptick in his on-base percentage, famously a crucial measure of contribution to the team. Currently, he’s sitting on an OBP of .538, driven in large part by 4 walks in 13 plate appearances. At .31 walks per plate appearance, he’s nearly triple his highest previous career season (.11) and over tripled his career mark (.09). He’s unlikely to sustain this; however, his OBP has climbed the past two seasons from a historical low of .281 in 2014 to a so-so .309 in 2016. It’s possible that Bruce is showing an early hot streak that is, nonetheless, a sign of growth at the plate.
If Bruce were following a normal trend, we’d expect him to be at about .0838 walks per plate appearance. As noted, he’s at .31. In any 100 streaks of 13 plate appearances, he should be somewhere between .00 and .25 95 times. Although this is a very small sample size, it’s likely that Bruce has made some changes in his approach at the plate, especially since those walks haven’t been intentional.
I’ve included a line chart of Bruce’s season walks and OBP over his time in the majors.
Mets Game 2 Commentary: Sometimes, you just know. April 6, 2017
Posted by tomflesher in Baseball.Tags: gratuitous Hansel Robles, Mets Game 2
add a comment
Hansel Robles entered last night’s game looking nervous. He closed his eyes, took a deep breath, and promptly gave up a tying run.
Hansel’s a tough pitcher to have in your bullpen, and we saw why last year and during the World Baseball Classic. Despite a thoroughly impressive outing in the Mets’ opener, he seemed easily shaken last night and allowed a Nick Markakis triple that turned into a run. He promptly walked Brandon Phillips, allowed an Adonis Garcia double on which Phillips was thankfully held at third, and then plunked Kurt Suzuki. Though Hansel has had his anger issues in the past, this one wasn’t intentional; Terry Collins removed him for Jerry Blevins because Hansel was having one of his trademark meltdowns.
You never know before the game which Hansel will come in, but he was visibly shaken when he got started. I’m starting to wonder, especially after the Mark Texeira incident, whether he should be on a beta blocker or something.
Despite a strong hitting performance by Jay Bruce (3-5, HR, 2B), 0-4s from Lucas Duda and Asdrubal Cabrera and 0-5s from Neil Walker and Curtis Granderson meant that the team couldn’t recover from Robles’ one run and Blevins’ cleanup. Though the backbone of the bullpen – Fernando Salas and Addison Reed – got us through the regular innings, lefty specialist Josh Edgin uncharacteristically had to work a full inning and the Mets went to erstwhile long man Rafael Montero. Montero was so-so, allowing three walks (one intentional) and three hits in an inning and 2/3.
Matt Harvey starts tonight against Jaime Garcia. Harvey has held Freddie Freeman to a .167 OBP in 18 plate appearances but has had considerably more trouble with Ender Inciarte and Jace Peterson. Curiously, Chase d’Arnaud is 1-3 against Harvey, but probably won’t be wedged into the lineup tonight. Meanwhile, Garcia has allowed OBPs over .400 to Lucas Duda (.750), Asdrubal Cabrera (.500) and Wilmer Flores (.429). Bruce has seen the most of Garcia but fared poorly – .224/.235/.306 in 51 plate appearances. It’s too early in the season to play mix and match, especially with Michael Conforto the main option to relieve Bruce against the lefty Garcia – not going to happen. I wouldn’t be stunned to see Ty Kelly start the game in the field, since he’s got a very good numbers in a small sample against left-handers (.368/.500/.474 in 12 plate appearances), but the blowback against that decision and the chance it would disrupt Bruce’s positive reception make that unlikely.
