Kirk’s Big Spring March 20, 2015
Posted by tomflesher in Baseball, Economics.Tags: BABIP, KBB, Kirk Nieuwenhuis, Spring training
add a comment
Kirk Nieuwenhuis is having an incredible spring. All the usual caveats are in play – it’s spring training, so the stats are useless – but Kirk’s production has been exceptional. His slash line is .469/.553/.625 on 38 plate appearances. Let’s hit some sanity checks on Kirk’s production.
First of all, his BAbip is off the charts. This spring, Kirk’s batting average on balls in play is .536, which is ridiculously high. Kirk won’t be able to maintain that into the season. If he’s still got a .536 OBP by the trade deadline, I’ll eat my hat and post the video. Kirk’s BAbip has been pretty streaky, though. During his rough April, Kirk had a .300 BAbip, about the league average over the season; after coming back up in late June, he had a .377 BAbip over the remainder of the season, broken up as .625 over five June games with 11 at-bats, .267 over 28 at-bats in July, .400 over 23 August at-bats, and .348 over 32 at-bats in September.
From 2012 to 2013, Kirk’s BAbip dropped from about .379 to .246, and then shot back up to .370 in 2014. Using those numbers and taking first differences, then using the ratio of differences, that means we’d expect Kirk’s BAbip to drop to about .254 this season. Nonetheless, Kirk’s platoon splits are huge – against right-handed pitchers, from 2014, he’s got a .040/.050/.283 split (although he only made 9 at-bats and 10 plate appearances against left-handed pitchers). Though Kirk’s splits aren’t readily available, it’s possible that his big spring is residual of facing mostly right-handers.
In the spring, Kirk’s BAbip denominator (AB – HR – K – SF) is 28 and the numerator (H – HR) is 15. If we take Kirk’s previous-year .377 BAbip, over 28 trials we’d expect 15 or more successes to occur about 2.86% of the time. That’s just barely within the bounds of statistical significance (which would indicate we’d expect Kirk to hit between 6 and 15 times about 95% of the time), and well outside if we assume Kirk has a true mean of .254 (which would put our confidence interval at around 3-11 successes in 28 trials).
Second, take a look at Kirk’s K/BB ratio. Kirk has typically had a strikeout-to-walk ratio above 1; in 2013, he struck out about 2.67 times for every time he walked, and in 2014 it was about 2.44 strikeouts per walk. Over this small spring sample size, Kirk’s K/BB has actually dipped below 1, at 4/6 (or .667). Assuming Kirk walked 6 times anyway, using a conservative 2:1 K/BB ratio would turn 8 of Kirk’s hits into strikeouts. That would make Kirk’s BAbip tighten up to .350. Still strong, but not the obscene .536 we’ve seen. Even if we convert one walk to a strikeout and maintain a 2 K/BB, that would leave Kirk at .409, a very respectable spring.
Kirk’s numbers have been shocking, and of course he’s out of options, so he’s extremely likely to make the team. As a left-handed bat, he’d be a strong everyday player if the outfield weren’t so crowded, but with Michael Cuddyer and Juan Lagares in the mix already along with lefties Curtis Granderson and Matt den Dekker, it’s going to be tough to find Kirk a clean platoon spot.
It’s great to have Lagares back, but he could walk a little more. May 5, 2014
Posted by tomflesher in Baseball.Tags: Juan Lagares, KBB, Mets, plate discipline, Strikeout-to-walk ratio
add a comment
Juan Lagares spent the last couple of weeks of April on the disabled list. He rejoined the team for the series against the Rockies and promptly showed us why he’s so valuable in the lineup.
Although Lucas Duda leads the team in OBP with a .361 mark on the season, Lagares is right there with him at .360 on the season. Lagares gets on base around the same amount, but his team-leading .507 SLG outpaces Duda’s .447 mark considerably. That’s because in 22 fewer plate appearances, Lagares has three more doubles and one more triple than Dude; only Daniel Murphy, with 129 plate appearances to Lagares’ 75, has more doubles (8 to Juan’s 7), and Eric Young has two triples to Lagares and Murphy’s one. In fewer plate appearances, Lagares has more total bases than Murphy, Duda, and David Wright – 38% of his hits are for extra bases.
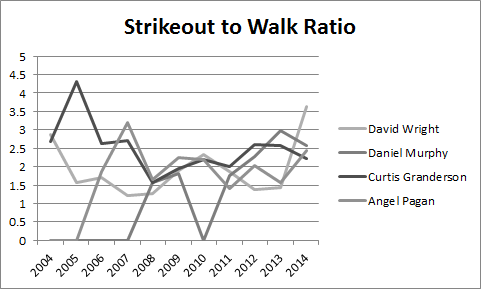
Strikeout-to-Walk ratio appears to contain a strong random element.
In fact, Lagares had a great series in Colorado, hitting four singles and four doubles but striking out six times in 20 plate appearances. He does, however, lead the team in KBB – he averages about 6.33 strikeouts for every walk he takes, more than double the league average of 2.72. On the other end of the scale you have players like Travis d’Arnaud and Ruben Tejada (whose plate discipline has been mentioned before on the World’s Worst Sports Blog), who average 1.33 and 1.5 strikeouts per walk, respectively. Moneyball seemed to indicate that it’s tough to teach plate discipline, and taking a look at Murphy and Wright’s numbers seems to indicate a substantial random element in KBB ratio. Angel Pagan and Curtis Granderson also round out the graph at left, which tracks strikeout-to-walk ratio over the past ten years.
Is there much hope of improving Lagares’ KBB ratio? Perhaps. Granderson’s spiked up and was on a downward trend for a while; on the other hand, Murphy’s has climbed steadily as he’s improved as a hitter. There are definitely some deeper relationships that merit further investigation.
