Why isn’t baseball’s free agent market clearing? February 21, 2019
Posted by tomflesher in Baseball, Economics.Tags: Baseball, economics, microeconomics, sabermetrics, sports economics, winner's curse
add a comment
There’s been some discussion of the free agent market in baseball and its alleged inefficiency – that players like Manny Machado don’t sign until February and Bryce Harper is still unsigned, for example. Adam Wainwright, for example, has threatened a strike over free agency.
Certainly, there are many factors in play. However, the fact that there are stars who aren’t being picked up doesn’t mean that there’s anything nefarious afoot. Brad Brach, who signed with the Cubs on February 11, has complained about the teams’ use of algorithms to value players:
Brad Brach on his free-agency experience: “We talked to certain teams and they told us that, ‘We have an algorithm and here’s where you fall.’ … It’s just kind of weird that all offers are the same, they come around the same time. Everybody tells you there’s an algorithm.”
— Jordan Bastian (@MLBastian) February 15, 2019
https://platform.twitter.com/widgets.js
Let’s take that at face value and build a model of algorithms and noise. (It seems that Brach is implying collusion by teams, but in a future post I’ll discuss why I don’t think that’s likely.)
First, the simplifying assumptions:
- Players have an accurate valuation of their own talent levels (This is difficult to justify because players have an incentive to overvalue themselves, but the conclusions would not change qualitatively by relaxing this assumption)
- Teams have a noisy valuation of players based on the players’ talent levels (This is essentially the face value Brach’s claim: that teams use ‘algorithms’ based on player talent.)
- There are two teams with similar noise levels. (Modeling different forms of bias, or different preferences by teams, would probably not change the outcome very much, but would affect the distribution of players. Meanwhile, the market for some players is fairly large, but for many it’s very small, especially as prices rise.)
- All contracts are for one year. (This avoids the trouble of modeling players’ intertemporal rates of substitution, but a future version of this model may include preferences about both pay and number of years.)
- If a player is offered a contract that he thinks accurately reflects or overpays him, he signs with the team that offers him the bigger contract.
Poorly-constructed R code for a simulated free agent season:
data<-matrix(1:5000,nrow=1000,ncol=5)

for (i in c(1:1000)){data[i,1] <- runif(1)

data[i,2] <- data[i,1]+rnorm(1,mean=0,sd=.05)

data[i,3] <- data[i,1]+rnorm(1,mean=0,sd=.1)

data[i,4] <- max(data[i,2],data[i,3])

data[i,5] <- if(data[i,4]>=data[i,1]) data[i,5]=1 else data[i,5]=0}
Basically, generate a vector of random player talent levels; team 1 accurately values players with a standard deviation of .05, while team 2 accurately values them with a standard deviation of .1. 1000 players go on the market. Outcome:
| V1 | V2 | V3 | V4 | V5 |
| Min. :0.0008885 | Min. : -0.1324 | Min. : -0.2024 | Min. : -0.1324 | Min. :0.000 |
| 1st Qu.:0.2613380 | 1st Qu.: 0.2621 | 1st Qu.: 0.2608 | 1st Qu.: 0.3012 | 1st Qu.:1.000 |
| Median :0.4984726 | Median : 0.4968 | Median : 0.5133 | Median : 0.5511 | Median :1.000 |
| Mean :0.4997539 | Mean : 0.4987 | Mean : 0.5087 | Mean : 0.548 | Mean :0.754 |
| 3rd Qu.:0.7425434 | 3rd Qu.: 0.743 | 3rd Qu.: 0.7566 | 3rd Qu.: 0.7912 | 3rd Qu.:1.000 |
| Max. :0.9995596 | Max. : 1.1115 | Max. : 1.2508 | Max. : 1.2508 | Max. :1.000 |
That’s right – only 754 of the 1000 players signed. (In multiple simulations, the signing rate hovers around 75%. This makes sense theoretically, since valuations are independent: half the players will be undervalued by each team so 1/4 will be undervalued by both teams.)
Interestingly, player 973 is unsigned:
[973,] 0.9683805341 0.9472948838 0.874961530 0.9472948838 0
He evaluated himself at below the 97th percentile, but got unlucky in that both teams evaluated him below that: team 1 would offer him a 95th percentile contract and team 2 would rank him even further down.
Meanwhile, player 25 gets lucky:
[25,] 0.0109281745 0.0236191242 0.089982324 0.0899823237 1
Despite being in the 1st percentile, both teams accidentally overvalue him, and his contract ends up being suited to a player with nearly 9 times his value. (For the phenomenon where competition leads reliably to overpayment, see “winner’s curse.”)
We’re going to see both of these types of errors in any market where there’s a subjective evaluation of players. Particularly if the teams are using algorithmic valuations, much of the information they’re based on is going to be publicly available; even if teams weight it differently, efficient algorithms are likely to produce similar results.
Are extra-innings contests evenly matched? (Mets Game 14) April 21, 2016
Posted by tomflesher in Baseball, Economics.Tags: extra innings, Mets game 14, probability, statistics
add a comment
The Mets lost to the Phillies in 11 innings last night. That was a surprising result – based on the run scoring in the first two games, the Pythagorean expectation for the same Mets team facing the same Phillies team would have been around 95.5%. Even going into extra innings seemed to be a stretch with Bartolo Colon pitching. Plus, the Phillies were in the bottom of the league in extra innings last year.
Addison Reed blew his first save of the year when he allowed a single to Peter Bourjos that scored David Lough. Despite strong performances from Antonio Bastardo and Jim Henderson, Hansel Robles allowed a double, a wild pitch, and a single that brought Freddy Galvis home.
Once we hit the tenth inning, it’s evidence that the teams are evenly matched, right? Not necessarily. in 2015, there were 212 extra-innings games. The home team won 111 of them, about 52.4%. That’s obviously higher than expected, but keep in mind that if this were a fifty-fifty coin flip we’d expect at least 111 wins around 22.5% of the time. Where it gets interesting is that the home team has (with the exception of 2014) consistently won over half those games, but that the more games that are played, the better visitors do. Since 2006, 2144 extra-innings games have been played with teams winning 1130 of them for a .527 winning percentage; that’s something that, if this truly is a 50-50 proposal, should only happen by chance 0.6% of the time.
| Year | G | W | L | perc |
| 2006 | 185 | 105 | 80 | 0.568 |
| 2007 | 220 | 117 | 103 | 0.532 |
| 2008 | 208 | 108 | 100 | 0.519 |
| 2009 | 195 | 106 | 89 | 0.544 |
| 2010 | 220 | 116 | 104 | 0.527 |
| 2011 | 237 | 134 | 103 | 0.565 |
| 2012 | 192 | 96 | 96 | 0.500 |
| 2013 | 243 | 125 | 118 | 0.514 |
| 2014 | 232 | 112 | 120 | 0.483 |
| 2015 | 212 | 111 | 101 | 0.524 |
| Total | 2144 | 1130 | 1014 | 0.527 |
One other result gives us pause: from 2006-2015, 24297 games were played and the home team won 13171 of them. That’s a considerable home field advantage, since all teams play half their games on the road and half at home. That corresponds to a .542 win probability for any home team. If that, rather than .500, is the expected win rate for a home team, then teams perform significantly worse in extra innings.
In other words, though the home team still has an advantage, that advantage shrinks once we hit the tenth inning.
The Mets are idle tonight. They’ll pick up in Atlanta on Friday.
The Rule 5 Draft and Daniel Stumpf’s Problem April 18, 2016
Posted by tomflesher in Baseball, Economics.2 comments
Rookie lefthander Daniel Stumpf was suspended for 80 games following a positive test for steroids. He had appeared in three games and allowed three runs in his first appearance but then made two one-out appearances as a left-handed specialist. Stumpf was a rule 5 draftee.
The Rule 5 draft allows teams to poach players who have been signed for five years (if the player originally signed when he was younger than 18) or four years (if the player signed as an adult) and who are not on any 40-man roster. It was designed to keep teams from signing prospects they had no plan to use in the near future, and to protect those prospects’ chances to make the majors. Current Blue Jay Jose Bautista and financial professional Bobby Bonilla were both rule 5 draftees early in their careers, for example, who may not have made the majors had their progress continued to be blocked.
Stumpf’s positive drug test amounts to a windfall for the team, however: part of the cost of drafting a player under rule 5 is that the player must remain on the team’s 25-man roster, the disabled list, or the restricted list for the entire season, accruing at least 90 days’ service time. The 25-man roster provision is designed to force a team to carry the player all year; if the team trades the rule 5 draftee, he must remain on the new team’s 25-man roster all season as well. Similarly, if he is waived, he must be offered back to his old team. This is designed to make it costly for a team to draft a young prospect: in order to make sense, the team’s expected value over the player’s career must be greater than the expected development value of the marginal player who the draftee will displace.
In Stumpf’s case, 24-year-old lefty Elvis Araujo has been called up to replace him. Araujo pitched 34 2/3 innings in 40 games last year – substantially less than one inning per game – last year, making him a close comparison to how Stumpf was being used. Araujo had a 3.38 ERA, so in order to make it rational to keep Stumpf on the roster over Araujo, the Phillies must have expected Stumpf to develop considerably more than Araujo over the course of the season and to remain valuable for at least a few more years. Stumpf will likely continue baseball activities over the course of the suspension, so his coaching and development will continue albeit without the pressure of major league appearances. Meanwhile, Araujo, a slightly more seasoned player, will make the appearances in the majors that Stumpf would have, allowing the Phillies to accrue the benefit of Stumpf’s rule 5 status with less of the cost. That is: Araujo is a better player now, and the Phillies would ordinarily need to sacrifice that benefit to have Stumpf, the better player in the future.
The disabled list exemption from the 25-man roster rule is sensible, but this rule allows the Phillies a windfall. Major League Baseball should consider a rule that pauses accrual of not only service time but also credit for time on the roster while a player is suspended. This would require Stumpf to spend at least 80 additional games on the Phillies 25-man roster at the beginning of next season, forcing the Phillies to make a tough choice about Stumpf and Araujo again in 2017.
Could James Loney fit on the roster? April 7, 2016
Posted by tomflesher in Baseball, Economics.Tags: James Loney, Mets, transactions
add a comment
The Rays released James Loney a few days ago. That’s a big drop down for the 31-year-old first baseman, who was 6th in Rookie of the Year polling in 2007. Though his bat slowed down in 2015 and he posted his worst lines since 2012, he still hit .280/.322/.357. Since the Rays released him, they’re due to pay him $8 million this year, meaning he could pull a Gary Sheffield and play for the league minimum. He doesn’t hit like a traditional first baseman: his 2015 numbers extrapolate to about 25 doubles and 6 home runs for a 162-game, 603-plate-appearance season. He’s a lifetime .266/.310/.418 pinch hitter, and he’s made three appearances as a pinch runner, with the last one coming in 2012. Loney is known as a solid defensive first baseman, although his defensive wins above replacement have been reliably negative and spiked down to -0.9 in 2014 and -0.7 last year.
![By Keith Allison from Owings Mills, USA (James Loney) [CC BY-SA 2.0], via Wikimedia Common](https://worldsworstsportsblog.com/wp-content/uploads/2016/04/james_loney_2013.jpg)
By Keith Allison from Owings Mills, USA (James Loney) [CC BY-SA 2.0], via Wikimedia Common
However, look at the marginal Mets player: Eric Campbell. With Wilmer Flores in a utility role and five full-time outfielders, picking up Loney would mean dropping Campbell or a pitcher. Conceivably we could talk trading Lucas Duda, but that’s not a move I can see the front office making (nor is it a move I’d endorse – Loney’s role would be as a lefty pinch hitter, double switch enabler, and defensive replacement). The Mets are carrying 12 pitchers, but that number includes the as-yet unproven Jim Henderson and starter-in-waiting Logan Verrett; one of them will have to go when Zack Wheeler comes back from Tommy John surgery. Temporarily dropping to 11 pitchers would set us up for a much nastier cut when Wheeler returns.
The truth is that Campbell isn’t a long-term solution, but Loney is even less of one. Campbell is expected to serve as a sixth outfielder in emergencies, while Loney hasn’t played the outfield since the Bush administration. Campbell was also called on to run for Travis d’Arnaud in Tuesday’s game, and logically he’s the soundest choice – Alejandro De Aza swiped 7 but got caught 5 times last year, and the 205-pound Flores isn’t exactly tearing up the base paths. Juan Lagares has some speed, but he’ll be starting games against lefties and won’t always be available from the bench. Loney is also a one-position player, and – though Flores’ ability to play anywhere in the infield is valuable – Campbell is there to prevent serious problems like Anthony Recker playing third base. Campbell also squatted a minor league game last year, so while I wouldn’t trust him to catch, he’s willing to do it.
I’d rather Campbell were playing every day – if he’s going to develop, he needs the time. But bringing in Loney and sending Campbell down would be a mistake for the Mets. It’s a shame. I like Loney. But I don’t think he’ll fit here.
Well, That’s a Thor Spot (Mets Game 2 commentary) April 6, 2016
Posted by tomflesher in Baseball, Economics.Tags: Mets bullpen, Mets Game 2
add a comment
Noah Syndergaard pitched six innings and gave up three hits and one walk, striking out nine, in his season debut. Jim Henderson and Addison Reed notched holds, and Jeurys Familia grabbed his first save of the season. Noted pest Eric Hosmer walked in the sixth inning following a steal by Lorenzo Cain, but was otherwise kept from buzzing around.
Kansas City’s Chris Young took a tough loss (game score of 54) with 93 pitches over 5 innings. Ordinarily, holding the opposition to two runs would be good enough for a win – Kansas City averaged 4.47 runs per game in 2015 – but Syndergaard and the bullpen kept it quiet. Luke Hochevar was a bright spot. He’s come in as a fireman in both games this season, pitching a third of an inning each time with two inherited runners. This season, he’s allowed 0 runs on four inherited. Last year, Luke had 20 inherited runners and scored six, all of which came when he inherited two runners and both scored. Thus far, Hochevar has been excellent as a bridge between a struggling reliever and the next inning, and used like this, he could potentially work every day. He allowed David Wright a high-leverage walk to load the bases, but struck out Yoenis Cespedes to end the inning with Juan Lagares and Travis d’Arnaud on base.

By slgckgc on Flickr (Original version), UCinternational (Crop). CC BY 2.0
Meanwhile, Jim Henderson struck out two for a perfect frame in the seventh, bridging the Mets from Syndergaard to setup man Addison Reed. Henderson lost some velocity on his fastball following Tommy John surgery but averaged 95.86 mph last night. I was expecting him to slow it down as a contrast from Syndergaard, but he kept the pressure on very nicely.
Travis d’Arnaud is having a slow start to the season, on base twice (walks) in eight plate appearances; Salvador Perez, the Royals’ catcher, is on once (single) in six. Catchers are expected to have slow beginnings, but some of them are in great shape so far. Oakland catcher Josh Phegley singled and doubled before being lifted for a pinch hitter; he’s got an OBP of 1.000 in those two appearances. Fellow catchers Chris Iannetta (.750/.857/.750), Nick Hundley (.500/.625/1.000) and Buster Posey (.333/.556/.833) all have OBPs over .500 to start the season. Noted try-hard Blake Swihart is 0-2 (one K) but walked twice; he’s hitting .000/.500/.000 in his only game so far. The median catcher has a .268 OBP so far this year, compared to .294 across last season.
The Mets are idle until Friday afternoon. Jacob deGrom is slated to start, with Bartolo Colon to start on Saturday, but if Baby deGrom makes an appearance, the Mets haven’t ruled out using Bartolo or Steven Matz on Friday. Future Mets closer Hansel Robles has now completed his suspension; expect him to be used in a role similar to Henderson’s moving forward.
Put Down The Pitchforks! (Mets Game 1 Commentary) April 4, 2016
Posted by tomflesher in Baseball, Economics.Tags: Matt Harvey, Recaps, Yoenis Cespedes
add a comment
In last night’s 4-3 loss to the Royals, Matt Harvey consistently pitched better than Edinson Volquez. Volquez’ control wasn’t where he wanted it to be; it was clear he was laboring as early as the third or fourth inning. Harvey, meanwhile, was fairly stellar through 5. He gave up a single run in the first inning, one in the fourth, and then two in the sixth (one allowed by Bartolo Colon in relief).
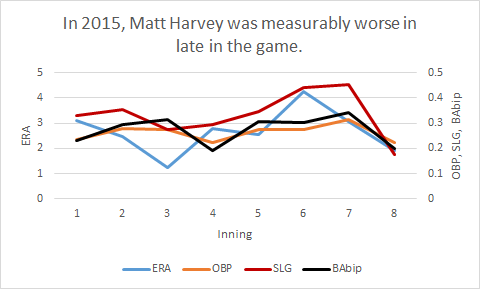
Matt Harvey shows a noticeable uptick in batting stats after the fifth inning.
The first run was produced by a combination of a Yoenis Cespedes error in left field and a Travis d’Arnaud passed ball which allowed Mike Moustakas to get on base and advance to third; an Eric Hosmer single brought Moustakas home. In 262 chances in left field in 2015, Cespedes made 5 errors (so he has an error rate of around .019). d’Arnaud had 1 passed ball in 845 plate appearances with a runner in position to steal (a rate of .001). The confluence of those two events is extremely low-probability, and really wasn’t Harvey’s problem. (That’s leaving aside some difficult defense allowing Hosmer’s single.)
Harvey’s control was good – he walked Lorenzo Cain twice, but also struck out two. In 21 at-bats, Harvey allowed 8 hits, for a BAbip of about .380. His second and third innings were perfect; his fourth and sixth innings were plagued by smart, scrappy play from the Royals. When given any opportunity, Kansas City converted it.
Harvey, though, does have visible difficulty when he gets into the late game. Keep in mind, he’s still young and spent last year recovering from Tommy John surgery; however, the line graph above shows four statistics that measure Harvey’s effectiveness, all of which show an upward jump in the sixth. Although his BAbip was lower in the fourth, we’d expect that to be relatively stable; it rises above .300 in the fifth and stays there. There is a drop in the seventh and eighth (and his sole ninth inning appearance was strong), but that presents an endogeneity problem – he stays in when he’s pitching well, but he almost always enters the sixth inning (26 appearances in 29 starts). Similarly, opponents seem to “figure out” Harvey as the game progresses: his OBP and SLG allowed rise sharply after the second appearance:
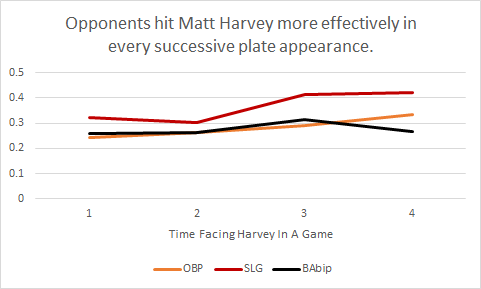
Harvey’s opponent “figure him out.”
Harvey didn’t have a “bad” game. He was left out longer than he should have been for confidence-related reasons, and he got a little unlucky. So stop playing the Family Guy clip, stop making urine-related jokes, and support the team.
How does scoring affect NHL standings? February 2, 2016
Posted by tomflesher in Economics, Hockey, Sports.Tags: hockey, modeling points, NHL, parameter estimation
add a comment
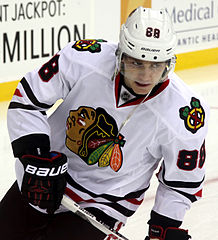
Patrick Kane (Lisa Gansky, Photo)
Patrick Kane (right) leads the league in goals and assists (and therefore total points). His Blackhawks are second in the league but lead the Western Conference, and are all but a lock to make the playoffs this season even with 29 games to go. Kane’s 30 goals (and 27.8 goals created) are a touch ahead of the second-place Jamie Benn and Alex Ovechkin, who each have 28 goals. Just how much, though, are those extra goals worth, and would it be better to focus on defense instead? In this entry, I’ll use some econometric modeling techniques to float an answer to that question.
When a team wins a game, they receive 2 points in the standings; a team that loses in regulation receives no points, but a team that loses in overtime or a shootout gets a consolation point for the tie after regulation. Since points, rather than direct win-loss records, are used to determine who makes the playoffs, it’s possible for a playoff team to have fewer points than a team that doesn’t make the playoffs. Though that didn’t happen in 2014-15, the Nashville Predators did finish ahead of the eventual Stanley Cup winning Chicago Blackhawks by having more points (104 to 102) despite having one win fewer (47 to 48). Nashville’s 10 overtime losses to Chicago’s 6 made the difference.
In a previous post, I calculated a pythagorean exponent useful for estimating a hockey team’s win-loss percentage and found a value of 2.11; a similar method to calculate the percentage of available points yields an exponent of 2.09. (That is, win-loss percentage and points percentage are really fairly close, in expectation terms.) Those models make the assumption that a goal against is worth the same as a goal for. Let’s try a couple of things to estimate the usefulness: first, let’s keep the same assumption, and fit a model of Points = a + b*Goals For – b*Goals Against. Using 2014-2015, that gives us an optimal model of Points = 92.2 + .357*Goals For – .357*Goals Against, with a sum of squared errors of 557.355.
Relaxing that assumption – allowing a goal for to be worth a different amount than a goal against – is theoretically justified by the fact that a losing team not only scores no points but loses the opportunity to score an overtime point, too. If we allow that flexibility, 2014-2015 gives us an estimated Points = 88.2 + .366*Goals For – .347*Goals Against, with a sum of squared errors of 555.594.
Since 88.2 points are expected in a season of 0-0 games, the expected points at the beginning of a game are approximately 88.2/82 = 1.076. Someone scores two, but the point given to the eventual losing team for a regulation tie pulls that average up a smidge.
The upshot of all of this? Defense is important, but since the expected points for a goal are higher than the expected penalty for allowing the other team to score, a team at the margin should consider signing a roving defenseman rather than a strictly defensive player – and it wouldn’t be crazy for a losing team to play four attackers and one defender for the last few minutes of the game, even before pulling the goalie.
After 20 Games, How Are The Sabres Distributing Ice Time? November 23, 2015
Posted by tomflesher in Economics, Hockey, Sports.Tags: analytics, Dan Bylsma, Evander Kane, NHL, Rasmus Ristolainen, Sabres, shots
add a comment
On Saturday, the Sabres managed to turn another close game into a decisive loss, and once again the game turned on the power play. Down 1-0 entering the third against Lindy Ruff‘s 16-4 Stars, Tyler Ennis took a crucial holding penalty to allow the Stars onto the power play. Though the Sabres had killed a trio of second-period penalties, they couldn’t take advantage of Dallas’s three penalties (including 51 seconds on the two-man advantage to start the second period). Jamie Benn knocked it in on the power play and then followed up less than two minutes later with a second goal; Antoine Russel had the go-ahead for Dallas in the first period.
Chad Johnson was back in net and saved 29 of 32, but the Sabres only took 22 shots on net. Dan Bylsma is on record as saying the quality, not the quantity, of shots is his aim. Bylsma certainly hasn’t rewarded a high proportion of shots while on ice; he’s rewarded players like Rasmus Ristolainen and captain Brian Gionta, both of whom are well below the 50% mark (meaning that the opposition takes more shots than the Sabres while Ristolainen or Gionta are on the ice), but Ristolainen is averaging almost 23 minutes per game and Gionta is hovering just below 18. In general, more minutes lead to more shots, of course, but there’s little informative about that.
Below is a bubble chart with Fenwick For% on the x-axis; Fenwick For% is the percentage of the total shots taken and attempted while the player is on-ice that were taken by the Sabres. On the y-axis is minutes per game. The bubbles are scaled by shots attempted by the player divided by total time on the ice, to show how influential each individual player’s shooting is on his own numbers.
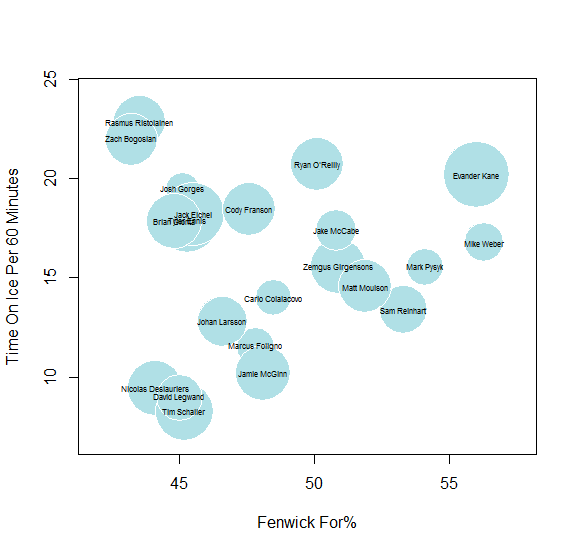
Bubbles are scaled by shots taken per minute on ice.
Evander Kane is hovering up around the 20 minute mark; he’s a clear outlier in terms of number of shots per minute, at 64 shots and averaging around 20 minutes per game. He’s also up on top of the Fenwick For%, at 56.0. As far as shots per minute, the decision seems to be hit and miss; of course Zach Bogosian is going to get some ice time to reacclimate despite not taking tons of shots, and Jack Eichel, Tyler Ennis, and Gionta are clustered around the 15-20-minute mark despite their low Fenwick numbers because of their relative importance to the team. Oddly, Josh Gorges is clustered right in there with them; like Ristolainen, his low Fenwick numbers seem to raise flags about his defense. Still, the shots per minute on ice seem to be scattered fairly randomly throughout the lineup.
Not every player is a scorer. It’s distressing, though, to see a player like defenseman Cody Franson taking 75 shots and averaging 18:27 over 20 games when he doesn’t seem to be preventing all that many shots; his 47.6 Fenwick For% is well below the 50-50 mark we’d hope for. Meanwhile, Chad Johnson’s .901 save percentage ranks him 50th out of 68 goalies in the NHL and he’s sporting a 117 GA%, meaning he’s allowed 17% more goals than average. (Linus Ullmark has an 87.) Ullmark may not maintain this consistency, but the Sabres have to protect Johnson if they’re going to keep these tight games from breaking open.
St Louis visits Buffalo tonight. Ullmark will start; his counterpart will likely be Jake Allen, who has a .930 save percentage to Ullmark’s .926 and an 82 GA%. Allen, 25, is a solid young goalie, but so is Ullmark. This one will depend on solid defense …. and, hopefully, avoiding power plays.
Sabres Game 19 Recap: Penalties are costly November 20, 2015
Posted by tomflesher in Economics, Hockey, Sports.Tags: Blues, Linus Ullmark, PDO, power play, Sabres
add a comment
Despite a solid performance by rookie goaltender Linus Ullmark, the Sabres dropped a shootout loss to the St. Louis Blues last night. Going into the shootout, the teams had played 65 minutes of 2-2 hockey. Sam Reinhart and Ryan O’Reilly scored at even strength for the Sabres; both Blues goals, by Kevin Shattenkirk and Vladimir Tarasenko, came on the power play. Those power plays were costly; Tyler Ennis was penalized 5 minutes for boarding at 5:00 into the first, and Shattenkirk’s goal followed 34 seconds later. In the third period, Jake McCabe was called for hooking 3:24 in, and Tarasenko’s goal came at 4:26. Alex Steen scored the only shootout goal for Saint Louis; O’Reilly, Ennis, and Evander Kane shot and missed for Buffalo. Meanwhile, the Blues’ penalties came in bunches, and the Sabres were woefully unable to take advantage of brief 2-man-advantage conditions in periods 2 and 3.
The Sabres aren’t a bad team on the power play – against a league average of 19.21% of power plays converted, the Sabres convert 22.58% of opportunities into goals. They’re much, much worse defensively, though: the league average penalty kill percentage is 80.79%1, but the Sabres kill only 72.92% of penalties. Buffalo has a miserable 96 power play PDO, which is an awful name for a great stat. In general, save% plus shooting% should average out to about 100, or so goes the theory; teams with lower scores are unluckier, and teams with higher scores are luckier. 96 in power play situations puts then 27th in the league. While shorthanded, they have an abysmal 92.3 PDO, 23rd in the league.
Some of that is mitigated by the Sabres’ low (thus far) penalty numbers – the average team has allowed 62 power play opportunities and the Sabres have allowed only 48 – but the Sabres have allowed 13 goals in those 48 opportunities while the league average is 12 goals on 62 opportunities. Just imagine if the Sabres were chippier and allowed more power plays.
The Sabres have fixed some of their early-season issues with shots, outshooting the Blues 34-29, and Ullmark (minion mask and all) managed to lower his goals against average to 2.31. He’s been remarkably consistent. He can’t, though, carry the team on his back. As a developing rookie, he needs his skaters to take advantage of those 2-man advantage situations. The Sabres had 2:35 of two-man advantage and couldn’t convert. A single goal would have put a second point on the board for the Sabres and another win in Ullmark’s record.
—
1 Obviously, the league average PP% and PK% have to add up to 100%.
Buffalo Sabres Game 18 Recap: Ullmark, Moulson, and Ristolainen November 18, 2015
Posted by tomflesher in Economics, Hockey, Sports.Tags: hockey, Recap, Sabres, Stars
add a comment
The Sabres dropped a game to Western Conference leaders the Dallas Stars on November 17th. Going into the final minutes, the Sabres were down 2-1, but after pulling goaltender Linus Ullmark they allowed an empty-net goal at 18:33. Dallas’ Alex Goligoski had two points for the Stars. Jack Eichel, Tyler Ennis, and Ryan O’Reilly each had four shots for the Sabres, with O’Reilly scoring the only goal for Buffalo.

Matt Moulson in 2013. Photo: Robert Kowal
Winger Matt Moulson led the team in Corsi REL% last night with 25.4. That is, 25.4% more shots are made by the Sabres than by their opponents in a hypothetical game in which Moulson plays all 60 minutes than in a hypothetical Moulson-free game. Moulson played 17:39 last night and took no shots himself, but he has a positive Corsi REL% every season since joining the Islanders in 2009. He was traded from New York to Buffalo after playing 11 games in 2013 with a -2.1, but bounced back in Buffalo for a 3.5 Corsi REL%. He had a cup of coffee in Minnesota with a 4.1 Corsi REL% in 20 games, finishing with a 2.3 on the season. Moulson came back to Buffalo thereafter.
Defender Rasmus Ristolainen led the team in shifts (30) and came in at 22:04 on the ice, five seconds behind leader Tyler Ennis. Ristolainen is getting a lot of ice time as a development move, and it’s starting to pay off – he’s taken 47 shots in 437 minutes over 18 games, when in 2013-14 he took a total of 52 in 650 minutes and 34 games. Ristolainen’s focus on playing scoring defense doesn’t appear to be paying off, though – even as he’s taking more shots, it appears from the statistics that he’s playing weaker defense. He’s taking more but allowing more, as well; although his Corsi For% is rising, it’s still weak (43.9%), and more shots are allowed to the defense while he’s on ice than while he’s off ice (reflected in his -9.0 Corsi REL%).

Linus Ullmark’s minion-themed mask
Linus Ullmark performed well, allowing 2 goals on 28 shots; the Sabres scored once on 26. Ullmark is 4-3, including a difficult November 5 loss to the Lightning. For a rookie, Ullmark’s 2.39 goals against average is solid – it’s better than Chad Johnson‘s 2.67, and Ullmark has a positive goals saved above average; it remains to be seen whether he’ll maintain his relatively high level of performance. So far, that single period against the Lightning seems to be a deviation. Johnson’s been much more variant. From a development perspective, I like seeing Linus start.
Both Buffalo and Dallas are idle tonight. The Sabres’ next game will be on the 19th at St. Louis.
