After 20 Games, How Are The Sabres Distributing Ice Time? November 23, 2015
Posted by tomflesher in Economics, Hockey, Sports.Tags: analytics, Dan Bylsma, Evander Kane, NHL, Rasmus Ristolainen, Sabres, shots
add a comment
On Saturday, the Sabres managed to turn another close game into a decisive loss, and once again the game turned on the power play. Down 1-0 entering the third against Lindy Ruff‘s 16-4 Stars, Tyler Ennis took a crucial holding penalty to allow the Stars onto the power play. Though the Sabres had killed a trio of second-period penalties, they couldn’t take advantage of Dallas’s three penalties (including 51 seconds on the two-man advantage to start the second period). Jamie Benn knocked it in on the power play and then followed up less than two minutes later with a second goal; Antoine Russel had the go-ahead for Dallas in the first period.
Chad Johnson was back in net and saved 29 of 32, but the Sabres only took 22 shots on net. Dan Bylsma is on record as saying the quality, not the quantity, of shots is his aim. Bylsma certainly hasn’t rewarded a high proportion of shots while on ice; he’s rewarded players like Rasmus Ristolainen and captain Brian Gionta, both of whom are well below the 50% mark (meaning that the opposition takes more shots than the Sabres while Ristolainen or Gionta are on the ice), but Ristolainen is averaging almost 23 minutes per game and Gionta is hovering just below 18. In general, more minutes lead to more shots, of course, but there’s little informative about that.
Below is a bubble chart with Fenwick For% on the x-axis; Fenwick For% is the percentage of the total shots taken and attempted while the player is on-ice that were taken by the Sabres. On the y-axis is minutes per game. The bubbles are scaled by shots attempted by the player divided by total time on the ice, to show how influential each individual player’s shooting is on his own numbers.
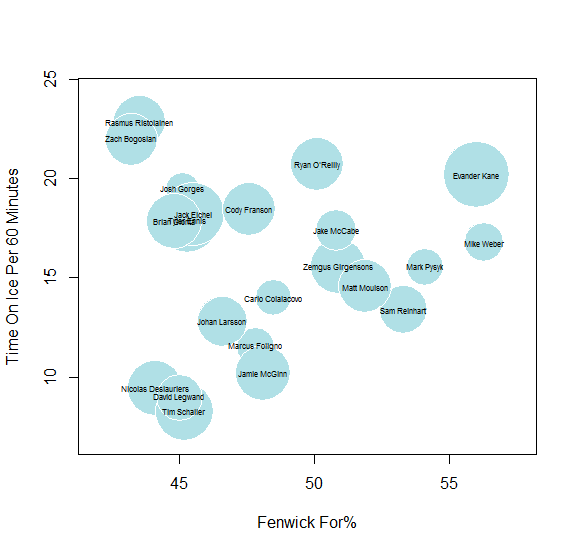
Bubbles are scaled by shots taken per minute on ice.
Evander Kane is hovering up around the 20 minute mark; he’s a clear outlier in terms of number of shots per minute, at 64 shots and averaging around 20 minutes per game. He’s also up on top of the Fenwick For%, at 56.0. As far as shots per minute, the decision seems to be hit and miss; of course Zach Bogosian is going to get some ice time to reacclimate despite not taking tons of shots, and Jack Eichel, Tyler Ennis, and Gionta are clustered around the 15-20-minute mark despite their low Fenwick numbers because of their relative importance to the team. Oddly, Josh Gorges is clustered right in there with them; like Ristolainen, his low Fenwick numbers seem to raise flags about his defense. Still, the shots per minute on ice seem to be scattered fairly randomly throughout the lineup.
Not every player is a scorer. It’s distressing, though, to see a player like defenseman Cody Franson taking 75 shots and averaging 18:27 over 20 games when he doesn’t seem to be preventing all that many shots; his 47.6 Fenwick For% is well below the 50-50 mark we’d hope for. Meanwhile, Chad Johnson’s .901 save percentage ranks him 50th out of 68 goalies in the NHL and he’s sporting a 117 GA%, meaning he’s allowed 17% more goals than average. (Linus Ullmark has an 87.) Ullmark may not maintain this consistency, but the Sabres have to protect Johnson if they’re going to keep these tight games from breaking open.
St Louis visits Buffalo tonight. Ullmark will start; his counterpart will likely be Jake Allen, who has a .930 save percentage to Ullmark’s .926 and an 82 GA%. Allen, 25, is a solid young goalie, but so is Ullmark. This one will depend on solid defense …. and, hopefully, avoiding power plays.
