After 20 Games, How Are The Sabres Distributing Ice Time? November 23, 2015
Posted by tomflesher in Economics, Hockey, Sports.Tags: analytics, Dan Bylsma, Evander Kane, NHL, Rasmus Ristolainen, Sabres, shots
add a comment
On Saturday, the Sabres managed to turn another close game into a decisive loss, and once again the game turned on the power play. Down 1-0 entering the third against Lindy Ruff‘s 16-4 Stars, Tyler Ennis took a crucial holding penalty to allow the Stars onto the power play. Though the Sabres had killed a trio of second-period penalties, they couldn’t take advantage of Dallas’s three penalties (including 51 seconds on the two-man advantage to start the second period). Jamie Benn knocked it in on the power play and then followed up less than two minutes later with a second goal; Antoine Russel had the go-ahead for Dallas in the first period.
Chad Johnson was back in net and saved 29 of 32, but the Sabres only took 22 shots on net. Dan Bylsma is on record as saying the quality, not the quantity, of shots is his aim. Bylsma certainly hasn’t rewarded a high proportion of shots while on ice; he’s rewarded players like Rasmus Ristolainen and captain Brian Gionta, both of whom are well below the 50% mark (meaning that the opposition takes more shots than the Sabres while Ristolainen or Gionta are on the ice), but Ristolainen is averaging almost 23 minutes per game and Gionta is hovering just below 18. In general, more minutes lead to more shots, of course, but there’s little informative about that.
Below is a bubble chart with Fenwick For% on the x-axis; Fenwick For% is the percentage of the total shots taken and attempted while the player is on-ice that were taken by the Sabres. On the y-axis is minutes per game. The bubbles are scaled by shots attempted by the player divided by total time on the ice, to show how influential each individual player’s shooting is on his own numbers.
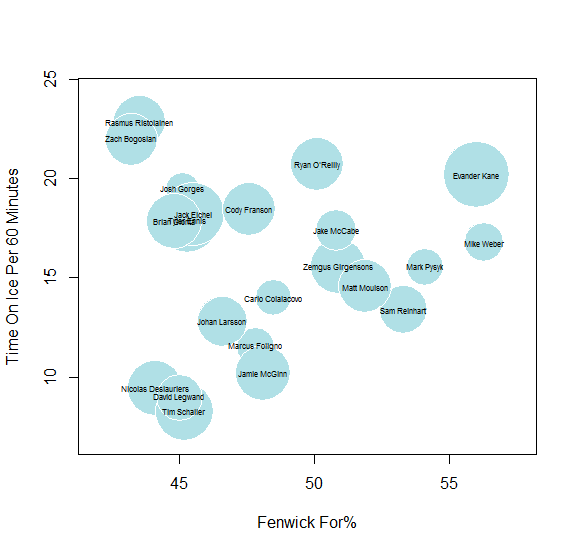
Bubbles are scaled by shots taken per minute on ice.
Evander Kane is hovering up around the 20 minute mark; he’s a clear outlier in terms of number of shots per minute, at 64 shots and averaging around 20 minutes per game. He’s also up on top of the Fenwick For%, at 56.0. As far as shots per minute, the decision seems to be hit and miss; of course Zach Bogosian is going to get some ice time to reacclimate despite not taking tons of shots, and Jack Eichel, Tyler Ennis, and Gionta are clustered around the 15-20-minute mark despite their low Fenwick numbers because of their relative importance to the team. Oddly, Josh Gorges is clustered right in there with them; like Ristolainen, his low Fenwick numbers seem to raise flags about his defense. Still, the shots per minute on ice seem to be scattered fairly randomly throughout the lineup.
Not every player is a scorer. It’s distressing, though, to see a player like defenseman Cody Franson taking 75 shots and averaging 18:27 over 20 games when he doesn’t seem to be preventing all that many shots; his 47.6 Fenwick For% is well below the 50-50 mark we’d hope for. Meanwhile, Chad Johnson’s .901 save percentage ranks him 50th out of 68 goalies in the NHL and he’s sporting a 117 GA%, meaning he’s allowed 17% more goals than average. (Linus Ullmark has an 87.) Ullmark may not maintain this consistency, but the Sabres have to protect Johnson if they’re going to keep these tight games from breaking open.
St Louis visits Buffalo tonight. Ullmark will start; his counterpart will likely be Jake Allen, who has a .930 save percentage to Ullmark’s .926 and an 82 GA%. Allen, 25, is a solid young goalie, but so is Ullmark. This one will depend on solid defense …. and, hopefully, avoiding power plays.
Sabres Game 19 Recap: Penalties are costly November 20, 2015
Posted by tomflesher in Economics, Hockey, Sports.Tags: Blues, Linus Ullmark, PDO, power play, Sabres
add a comment
Despite a solid performance by rookie goaltender Linus Ullmark, the Sabres dropped a shootout loss to the St. Louis Blues last night. Going into the shootout, the teams had played 65 minutes of 2-2 hockey. Sam Reinhart and Ryan O’Reilly scored at even strength for the Sabres; both Blues goals, by Kevin Shattenkirk and Vladimir Tarasenko, came on the power play. Those power plays were costly; Tyler Ennis was penalized 5 minutes for boarding at 5:00 into the first, and Shattenkirk’s goal followed 34 seconds later. In the third period, Jake McCabe was called for hooking 3:24 in, and Tarasenko’s goal came at 4:26. Alex Steen scored the only shootout goal for Saint Louis; O’Reilly, Ennis, and Evander Kane shot and missed for Buffalo. Meanwhile, the Blues’ penalties came in bunches, and the Sabres were woefully unable to take advantage of brief 2-man-advantage conditions in periods 2 and 3.
The Sabres aren’t a bad team on the power play – against a league average of 19.21% of power plays converted, the Sabres convert 22.58% of opportunities into goals. They’re much, much worse defensively, though: the league average penalty kill percentage is 80.79%1, but the Sabres kill only 72.92% of penalties. Buffalo has a miserable 96 power play PDO, which is an awful name for a great stat. In general, save% plus shooting% should average out to about 100, or so goes the theory; teams with lower scores are unluckier, and teams with higher scores are luckier. 96 in power play situations puts then 27th in the league. While shorthanded, they have an abysmal 92.3 PDO, 23rd in the league.
Some of that is mitigated by the Sabres’ low (thus far) penalty numbers – the average team has allowed 62 power play opportunities and the Sabres have allowed only 48 – but the Sabres have allowed 13 goals in those 48 opportunities while the league average is 12 goals on 62 opportunities. Just imagine if the Sabres were chippier and allowed more power plays.
The Sabres have fixed some of their early-season issues with shots, outshooting the Blues 34-29, and Ullmark (minion mask and all) managed to lower his goals against average to 2.31. He’s been remarkably consistent. He can’t, though, carry the team on his back. As a developing rookie, he needs his skaters to take advantage of those 2-man advantage situations. The Sabres had 2:35 of two-man advantage and couldn’t convert. A single goal would have put a second point on the board for the Sabres and another win in Ullmark’s record.
—
1 Obviously, the league average PP% and PK% have to add up to 100%.
Buffalo Sabres Game 18 Recap: Ullmark, Moulson, and Ristolainen November 18, 2015
Posted by tomflesher in Economics, Hockey, Sports.Tags: hockey, Recap, Sabres, Stars
add a comment
The Sabres dropped a game to Western Conference leaders the Dallas Stars on November 17th. Going into the final minutes, the Sabres were down 2-1, but after pulling goaltender Linus Ullmark they allowed an empty-net goal at 18:33. Dallas’ Alex Goligoski had two points for the Stars. Jack Eichel, Tyler Ennis, and Ryan O’Reilly each had four shots for the Sabres, with O’Reilly scoring the only goal for Buffalo.

Matt Moulson in 2013. Photo: Robert Kowal
Winger Matt Moulson led the team in Corsi REL% last night with 25.4. That is, 25.4% more shots are made by the Sabres than by their opponents in a hypothetical game in which Moulson plays all 60 minutes than in a hypothetical Moulson-free game. Moulson played 17:39 last night and took no shots himself, but he has a positive Corsi REL% every season since joining the Islanders in 2009. He was traded from New York to Buffalo after playing 11 games in 2013 with a -2.1, but bounced back in Buffalo for a 3.5 Corsi REL%. He had a cup of coffee in Minnesota with a 4.1 Corsi REL% in 20 games, finishing with a 2.3 on the season. Moulson came back to Buffalo thereafter.
Defender Rasmus Ristolainen led the team in shifts (30) and came in at 22:04 on the ice, five seconds behind leader Tyler Ennis. Ristolainen is getting a lot of ice time as a development move, and it’s starting to pay off – he’s taken 47 shots in 437 minutes over 18 games, when in 2013-14 he took a total of 52 in 650 minutes and 34 games. Ristolainen’s focus on playing scoring defense doesn’t appear to be paying off, though – even as he’s taking more shots, it appears from the statistics that he’s playing weaker defense. He’s taking more but allowing more, as well; although his Corsi For% is rising, it’s still weak (43.9%), and more shots are allowed to the defense while he’s on ice than while he’s off ice (reflected in his -9.0 Corsi REL%).

Linus Ullmark’s minion-themed mask
Linus Ullmark performed well, allowing 2 goals on 28 shots; the Sabres scored once on 26. Ullmark is 4-3, including a difficult November 5 loss to the Lightning. For a rookie, Ullmark’s 2.39 goals against average is solid – it’s better than Chad Johnson‘s 2.67, and Ullmark has a positive goals saved above average; it remains to be seen whether he’ll maintain his relatively high level of performance. So far, that single period against the Lightning seems to be a deviation. Johnson’s been much more variant. From a development perspective, I like seeing Linus start.
Both Buffalo and Dallas are idle tonight. The Sabres’ next game will be on the 19th at St. Louis.
Evaluating Hockey Analytics (and bonus luck numbers through November 15, 2015) November 16, 2015
Posted by tomflesher in Economics, Hockey, Sports.Tags: Corsi, Fenwick, Hockey analytics, NHL, Pythagorean expectation, Pythagorean luck, Sabres
add a comment
The Buffalo Sabres have been having a weird season. They’ve been outshot and won, they’ve outshot their opponents and lost, and (aside
from starting goalie Chad Johnson) their ice time leader, defenseman Rasmus Ristolainen, is bringing up the rear in relative Corsi and Fenwick stats. Ristolainen has a nasty -9.5 Corsi Rel, while fellow defenders Jake McCabe, Mark Pysyk, and Mike Weber have 8.5, 9.1, and 13.5, respectively. Ristolainen is averaging over 24 minutes a game, with the other three down by six to eight minutes each. What’s more, Ristolainen appears to be pulling his weight – he’s made 45 shots, second only to center Jack Eichel, and has 4 goals with an 8.9 shooting percentage. Ristolainen has 11 points (second only to Ryan O’Reilly with 14) but is tied with Tyler Ennis for the team’s worst +/- at -6. See? Weird year so far.
A lot of that is small sample size, of course. The Sabres are only 17 games into the 82-game season. They are, however, looking awfully lucky so far. Just how lucky? Let’s find out using the same Pythagorean metric that shows up in baseball.
Since Corsi and Fenwick both measure attempts to shoot, they’re noisier than goals. I was curious how much noisier, so I fired up R using the 2014 data and decided to update my post from earlier this year about the optimal Pythagorean exponent for the NHL. In it, I set up three minimization problems, all of them estimating winning percentage (and counting overtime losses as losses – the exponent changes only slightly if you estimate points-percentage instead of wins). Those three problems each minimized the sum of squares, using the Pythagorean formulas. The first used the traditional method of estimating goals and goals against; the second used Corsi For and Corsi Against; the third used Fenwick For and Fenwick Against.
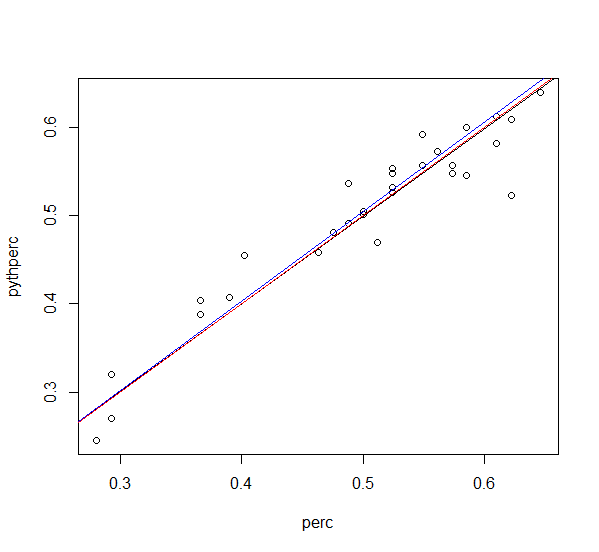
Pythagorean 2.11 in black, Corsi 1.445 in blue, and Fenwick 1.88 in red.
The Goals For/Goals Against form (

The Corsi For/Corsi Against form returns an optimal x of 1.445, but the residual sum of squares ballooned to .24. That means on average the squared error is almost ten times as great – you get a pretty good predictor, but with much more “noise.”
Right in the middle, the Fenwick form yields an optimal x of 1.877, with a residual squared error of .203. It’s a better predictor of wins and losses than the Corsi version, but it’s still not as good a predictor of wins as the simple Goals For/Goals Against form.
Above, I’ve graphed each team’s winning percentage against the Pythagorean (Goals For/Goals Against form), as well as all three trendlines: note that the black Goals line and the red Fenwick line are extremely close, while the blue Corsi line is a bit higher up. Two conclusions can be drawn:
- The Fenwick line is a better predictor than the Corsi line, but the Corsi line appears to bias expected percentage upward. That is, it overestimates the imact of each shot more than goals and Fenwick do.
- Since the Fenwick line is a better predictor, that indicates that Corsi’s inclusion of blocked shots probably does just add noise. Blocked shots are, at least according to this model, of limited predictive value.
Through November 15, Corsi For % had a correlation of .11 with points and .125 with winning percentage; Fenwick For % had correlations of .17 and .19, respectively. Blocked shots had negative correlations in both cases.
Pythagorean luck is defined as the number of wins above expectation. Behind the jump are the numbers, through November 15, demonstrating which teams are lucky and which aren’t.
Chad Johnson saves the day – or at least helps a little November 11, 2015
Posted by tomflesher in Hockey, Sports.Tags: Chad Johnson, hockey, hockey-reference.com, Lightning, Sabres
add a comment
The Sabres (7-8-0) picked off the Lightning (7-8-2) last night in Tampa Bay, scoring four goals including one empty-netter by Rasmus Ristolainen with an assist from goalie Chad Johnson. The lanky Albertan started his ninth game of the year and pulled his 2.47 goals against average down with a one-goal complete game. Ristolainen has 3 points and a -2 plus/minus over his last five games, so the empty-net goal was a nice lift for him.
The Lightning outshot the Sabres 31-26, so Johnson’s performance was quite important. In the 2014 season, shots had about a .50 correlation with points and a slightly smaller (.49993) correlation with wins. A quick regression analysis shows that shots on goal have a statistically significant effect on both wins and points: one shot corresponds to about .023 wins and about .045 points, both significant at p < .01. Since the Lightning outshot the Sabres last night, there’s a reason that Johnson’s ‘miraculous’ saves were so key.
A Pythagorean Exponent for the NHL March 17, 2015
Posted by tomflesher in Sports.Tags: hockey, luck, NHL, parameter identification, Pythagorean expectation, Sabres
4 comments
A Pythagorean expectation is a statistic used to measure how many wins a team should expect, based on how many points they score and how many they allow. The name ‘Pythagorean’ comes from the Pythagorean theorem, which measures the distance between the two short sides of a right triangle (the hypotenuse); the name reflects the fact that early baseball-centric versions assumed that Runs^2/(Runs^2 + Runs Allowed^2) should equal the winning percentage, borrowing the exponent of 2 from the familiar Pythagorean theorem (a^2 +b^2 =c^2).
The optimal exponent turned out not to be 2 in just about any sport; in baseball, for example, the optimal exponent is around 1.82. This is found by setting up a function – in the case of the National Hockey League, that formula would be 

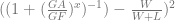
Porting that exponent into the current season, there are a few surprises. First of all, the Anaheim Ducks have been lucky – almost six full wins worth of luck. It would hardly be surprising for them to tank the last few games of the season. Similarly, the Washington Capitals are on the precipice of the playoff race, but they’re over four games below their expected wins. With 11 games to go, there’s a good chance they can overtake the New York Islanders (who are 3.4 wins above expectation), and they’re likely to at least maintain their wild card status.
On the other end, somehow, the Buffalo Sabres are obscenely lucky. The worst team in the NHL today is actually 4 games better than its expectation. Full luck standings as of the end of March 16th are behind the cut.
