Trends in Hat Tricks, 1987-2016 February 9, 2016
Posted by tomflesher in Hockey, Sports.Tags: data visualization, hat trick, hockey, time series
trackback
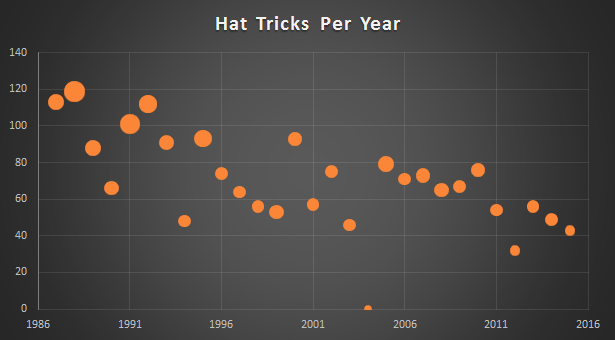
Hat tricks, 1987-2016; bubble size is the number of hat tricks by that year’s leader
Yesterday’s post on hat tricks raised a question – what’s the historical likelihood of a hat trick? Above is a time series of hat tricks by year, with bubble size weighted by the number of hat tricks scored by that year’s leader. The largest bubble is Mario Lemieux with 9 in 1988-89. The largest since 2000 was Jonathan Cheechoo with 5 in 2005-2006.
This looks like a significant downward trend, and it is; with each passing year, and controlling for games played, the expected number of hat tricks declines by about 1.2 (p = .0147). Meanwhile, adding another game to each team’s schedule seems to increase the number of hat tricks in a season by about .85 (p = .00005). There’s no statistical persistence of the numbers (that is, the lag of hat tricks has a coefficient not statistically different from 0). This downward trend is a bit confusing, since at first glance there hasn’t been a visible decrease in the quality of goaltending. That’s probably my next project.

Comments»
No comments yet — be the first.