Trends in Hat Tricks, 1987-2016 February 9, 2016
Posted by tomflesher in Hockey, Sports.Tags: data visualization, hat trick, hockey, time series
add a comment
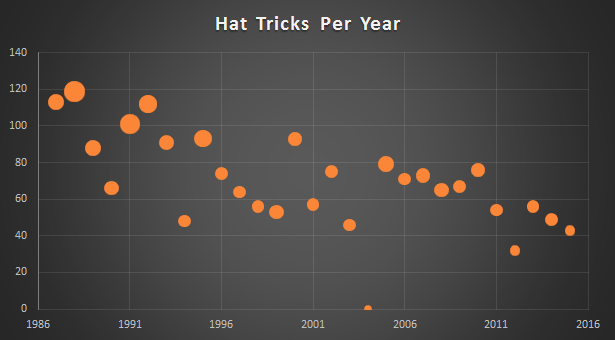
Hat tricks, 1987-2016; bubble size is the number of hat tricks by that year’s leader
Yesterday’s post on hat tricks raised a question – what’s the historical likelihood of a hat trick? Above is a time series of hat tricks by year, with bubble size weighted by the number of hat tricks scored by that year’s leader. The largest bubble is Mario Lemieux with 9 in 1988-89. The largest since 2000 was Jonathan Cheechoo with 5 in 2005-2006.
This looks like a significant downward trend, and it is; with each passing year, and controlling for games played, the expected number of hat tricks declines by about 1.2 (p = .0147). Meanwhile, adding another game to each team’s schedule seems to increase the number of hat tricks in a season by about .85 (p = .00005). There’s no statistical persistence of the numbers (that is, the lag of hat tricks has a coefficient not statistically different from 0). This downward trend is a bit confusing, since at first glance there hasn’t been a visible decrease in the quality of goaltending. That’s probably my next project.
Visualizing 2-Out RBIs September 8, 2015
Posted by tomflesher in Baseball, Economics, Sports.Tags: 2-out RBIs, data visualization
add a comment
In yesterday’s win against the Nationals, Yoenis Cespedes hit a crucial RBI double to score David Wright. What’s more, this came with two outs. In every game against the Nationals, the Mets’ postseason is at stake, so even though Cespedes’ hit wasn’t a go-ahead run, the insurance was key.
The Mets haven’t had a great season with two outs; they have 182, 24th in the Majors. Of those 182, 25 were hit by Lucas Duda, who isn’t even active (he’s on the disabled list). That’s quite distinct from Kansas City, which has 51 of its 2-out RBIs credit to Kendrys Morales; Duda, the Mets’ leader in 2-out RBIs, isn’t even in the top 40. I thought it would be interesting to mine whether teams with a lot of 2-out RBIs won a lot of games, and whether there was any information gained if most of those runs being batted in by one player.

In the graph above, the number of 2-out RBIs this season is on the horizontal axis, and the number of wins this season is on the vertical axis. The size of each dot represents the number of RBIs owed to the team’s top scorer.
There’s a weak correlation between wins and 2-out RBIs – about .25. That makes sense, given that more runs lead to more wins (correlation .39 this year). There’s a weaker correlation (.16) between the number of RBIs with 2 outs from the leading scorer and wins; that’s probably due to the runs effect, to be honest.
Take a look at Kansas City in the upper right, with lots of 2-out RBIs and Kendrys Morales’ enormous dot. Then, take a look at St Louis in the upper left – Kolten Wong is there with a tiny 25-RBI dot. Similarly, Nolan Arenado and his 47 RBIs with 2 outs haven’t done much to pull Colorado up out of the southeast corner of the graph. Also interesting is the overlay of Pittsburgh (Starling Marte, 38) on Kansas City – it doesn’t get much clearer that the correlation here is small.
