Trends in Hat Tricks, 1987-2016 February 9, 2016
Posted by tomflesher in Hockey, Sports.Tags: data visualization, hat trick, hockey, time series
add a comment
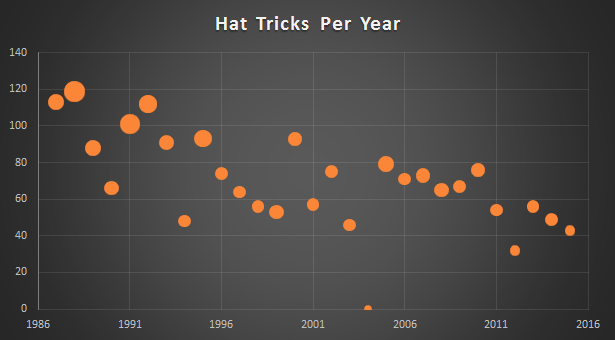
Hat tricks, 1987-2016; bubble size is the number of hat tricks by that year’s leader
Yesterday’s post on hat tricks raised a question – what’s the historical likelihood of a hat trick? Above is a time series of hat tricks by year, with bubble size weighted by the number of hat tricks scored by that year’s leader. The largest bubble is Mario Lemieux with 9 in 1988-89. The largest since 2000 was Jonathan Cheechoo with 5 in 2005-2006.
This looks like a significant downward trend, and it is; with each passing year, and controlling for games played, the expected number of hat tricks declines by about 1.2 (p = .0147). Meanwhile, adding another game to each team’s schedule seems to increase the number of hat tricks in a season by about .85 (p = .00005). There’s no statistical persistence of the numbers (that is, the lag of hat tricks has a coefficient not statistically different from 0). This downward trend is a bit confusing, since at first glance there hasn’t been a visible decrease in the quality of goaltending. That’s probably my next project.
Islanders Game 51: Okposo’s Hat Trick Helps the Isles Set The Mark February 8, 2016
Posted by tomflesher in Hockey, Sports.Tags: hat trick, hockey, Kyle Okposo
add a comment
In Sunday’s pre-Super Bowl game, the Islanders took out the Pacific division cellar dwellers, the Oilers, in an 8-1 rout. That’s not only tied for the largest goal differential this year, it’s also the most goals scored by any team this year. Kyle Okposo assisted a Nikolai Kulemin goal at the end of the first, scored two in the second about three and a half minutes apart, and sealed the hat trick with the only goal of the third period. Cal Clutterbuck also had a goal and an assist (on Johnny Boychuk‘s game-opening goal). Connor McDavid had the only goal for Edmonton.
Okposo’s hat trick was the 43rd of the season; probably the oddest was a baffling performance by Rasmus Ristolainen in December, in which he scored all three Sabres goals in a losing effort against the terrible Calgary Flames. Mikkel Boedker, John Gaudreau, Zach Parise, and Jeff Skinner each have two hat tricks this year. No one has cracked the three-hat-trick mark this season, although Max Pacioretty and Joe Pavelski each did so in 2013-2014.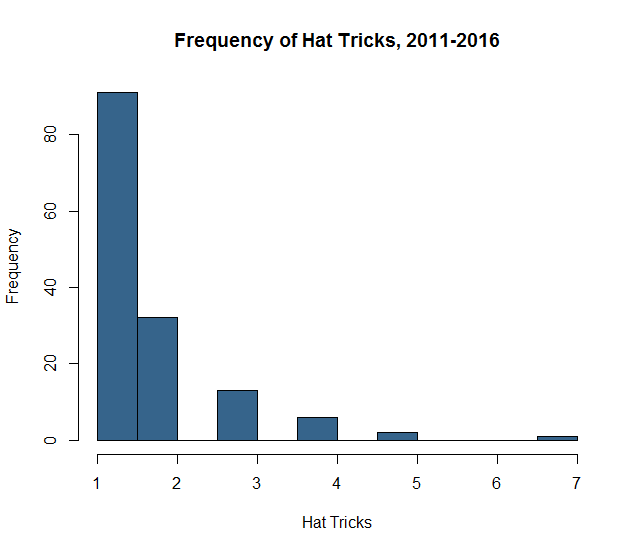
Hat tricks are interesting to model, because there are many complications in scoring them. Like John Scott‘s 2-goal performance in the All-Star game, it’s likely that hat tricks can be massaged along by teammates – feeding a player with two goals the puck in scoring situations, for example – so it’s difficult to argue that they can be poisson distributed (which would require their occurrence to be random). On the other hand, there’s clearly a reason why only 145 players have hat tricks over the last 5 seasons, why so few players have so many (Tyler Seguin with 7, two with 5, six with 4, 13 with 3, 21 with a pair, and the remainder with a single). The graph at right shows how thinly spread hat tricks tend to be over the past 5 seasons.
Sabres Game 51: Lehner wins it because Condon loses it February 4, 2016
Posted by tomflesher in Hockey, Sports.Tags: hockey, Robin Lehner, Sabres recap
add a comment
Despite a rough second period last night, Robin Lehner was in it for the whole game and the Sabres brought home a 4-2 win over the Montreal Canadiens. The Sabres scored 1 goal in the first and 3 (including an empty-netter by Brian Gionta) in the third to come back from a 2-1 deficit.

Peter Llewellyn, USA Today Sports, Photo
Lehner notched a save percentage of .943, saving 33 of 35 shots on the night. Montreal’s first goal came at 03:19 of the second, 1:08 into a Johann Larsen hooking penalty; it was the first time this season that Lehner allowed a power play goal. The team is 2-4 on the season in Lehner’s starts.
Montreal goalie Mike Condon seemed to lose equilibrium in the third; he faced 10 shots and allowed two goals. In the first two periods, he saved 20 of 21. Condon is 13-15-4 in starts, and the Canadiens are 1-2 in games where he’s come in to relieve Carey Price or Dustin Tokarski. Condon is 4-4 in overtime games, with one of those losses coming in a shootout, so he doesn’t seem to be a guy who gets exhausted and crumbles; he may have just had a nasty period.
The Sabres host Boston tonight; the Bruins have won their last three road games. Lehner will likely start against Tuuka Rask. Boston backup Jonas Gustavsson was placed on the injured reserve list with heart problems on February 1; the Bruins called up Malcolm Subban to serve as backup while Gustavsson is injured, but I’d be surprised to see the 22-year-old Subban (5.76 GAA in one career game) called on to start.
How does scoring affect NHL standings? February 2, 2016
Posted by tomflesher in Economics, Hockey, Sports.Tags: hockey, modeling points, NHL, parameter estimation
add a comment
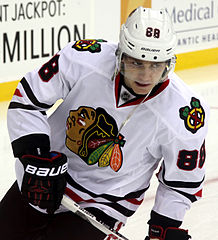
Patrick Kane (Lisa Gansky, Photo)
Patrick Kane (right) leads the league in goals and assists (and therefore total points). His Blackhawks are second in the league but lead the Western Conference, and are all but a lock to make the playoffs this season even with 29 games to go. Kane’s 30 goals (and 27.8 goals created) are a touch ahead of the second-place Jamie Benn and Alex Ovechkin, who each have 28 goals. Just how much, though, are those extra goals worth, and would it be better to focus on defense instead? In this entry, I’ll use some econometric modeling techniques to float an answer to that question.
When a team wins a game, they receive 2 points in the standings; a team that loses in regulation receives no points, but a team that loses in overtime or a shootout gets a consolation point for the tie after regulation. Since points, rather than direct win-loss records, are used to determine who makes the playoffs, it’s possible for a playoff team to have fewer points than a team that doesn’t make the playoffs. Though that didn’t happen in 2014-15, the Nashville Predators did finish ahead of the eventual Stanley Cup winning Chicago Blackhawks by having more points (104 to 102) despite having one win fewer (47 to 48). Nashville’s 10 overtime losses to Chicago’s 6 made the difference.
In a previous post, I calculated a pythagorean exponent useful for estimating a hockey team’s win-loss percentage and found a value of 2.11; a similar method to calculate the percentage of available points yields an exponent of 2.09. (That is, win-loss percentage and points percentage are really fairly close, in expectation terms.) Those models make the assumption that a goal against is worth the same as a goal for. Let’s try a couple of things to estimate the usefulness: first, let’s keep the same assumption, and fit a model of Points = a + b*Goals For – b*Goals Against. Using 2014-2015, that gives us an optimal model of Points = 92.2 + .357*Goals For – .357*Goals Against, with a sum of squared errors of 557.355.
Relaxing that assumption – allowing a goal for to be worth a different amount than a goal against – is theoretically justified by the fact that a losing team not only scores no points but loses the opportunity to score an overtime point, too. If we allow that flexibility, 2014-2015 gives us an estimated Points = 88.2 + .366*Goals For – .347*Goals Against, with a sum of squared errors of 555.594.
Since 88.2 points are expected in a season of 0-0 games, the expected points at the beginning of a game are approximately 88.2/82 = 1.076. Someone scores two, but the point given to the eventual losing team for a regulation tie pulls that average up a smidge.
The upshot of all of this? Defense is important, but since the expected points for a goal are higher than the expected penalty for allowing the other team to score, a team at the margin should consider signing a roving defenseman rather than a strictly defensive player – and it wouldn’t be crazy for a losing team to play four attackers and one defender for the last few minutes of the game, even before pulling the goalie.
NHL Pythagorean Luck through December 10, 2015 December 11, 2015
Posted by tomflesher in Hockey, Sports.Tags: hockey, NHL, Pythagorean expectation, wins above expectation
add a comment
Below is a plot of NHL teams’ Pythagorean luck through games played on December 10. The bubbles are scaled to the number of wins each team has.

Shockingly, the 12-16 Calgary Flames are 2.4 wins above their expectation, meaning that they should really be a 10-18 or 9-19 team right now. Meanwhile, the Canucks are suffering at 3.4 wins below expectation; at 11-19, they could easily be a .500 team if a few pucks had bounced differently.
Lucky wins for each team follow:
| Team | Lucky Wins |
| Dallas Stars | 2.97 |
| Montreal Canadiens | -1.23 |
| Washington Capitals | 1.58 |
| New York Rangers | -1.24 |
| Los Angeles Kings | 1.38 |
| New York Islanders | -0.77 |
| Detroit Red Wings | 1.09 |
| St. Louis Blues | 1.08 |
| Nashville Predators | 0.30 |
| Ottawa Senators | -0.21 |
| Chicago Blackhawks | -0.29 |
| Boston Bruins | -0.60 |
| Minnesota Wild | -0.23 |
| Florida Panthers | -0.93 |
| Pittsburgh Penguins | 1.28 |
| New Jersey Devils | -0.66 |
| Tampa Bay Lightning | -1.65 |
| Philadelphia Flyers | 1.41 |
| Winnipeg Jets | 0.58 |
| Vancouver Canucks | -3.40 |
| San Jose Sharks | 0.39 |
| Anaheim Ducks | 0.13 |
| Arizona Coyotes | 1.50 |
| Edmonton Oilers | -0.19 |
| Calgary Flames | 2.40 |
| Buffalo Sabres | -1.26 |
| Toronto Maple Leafs | -1.58 |
| Colorado Avalanche | -1.38 |
| Carolina Hurricanes | 0.23 |
| Columbus Blue Jackets | -0.70 |
| League Average | 0.00 |
Buffalo Sabres Game 18 Recap: Ullmark, Moulson, and Ristolainen November 18, 2015
Posted by tomflesher in Economics, Hockey, Sports.Tags: hockey, Recap, Sabres, Stars
add a comment
The Sabres dropped a game to Western Conference leaders the Dallas Stars on November 17th. Going into the final minutes, the Sabres were down 2-1, but after pulling goaltender Linus Ullmark they allowed an empty-net goal at 18:33. Dallas’ Alex Goligoski had two points for the Stars. Jack Eichel, Tyler Ennis, and Ryan O’Reilly each had four shots for the Sabres, with O’Reilly scoring the only goal for Buffalo.
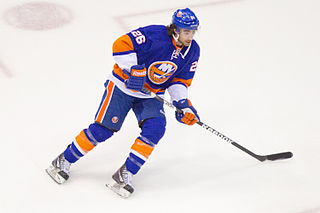
Matt Moulson in 2013. Photo: Robert Kowal
Winger Matt Moulson led the team in Corsi REL% last night with 25.4. That is, 25.4% more shots are made by the Sabres than by their opponents in a hypothetical game in which Moulson plays all 60 minutes than in a hypothetical Moulson-free game. Moulson played 17:39 last night and took no shots himself, but he has a positive Corsi REL% every season since joining the Islanders in 2009. He was traded from New York to Buffalo after playing 11 games in 2013 with a -2.1, but bounced back in Buffalo for a 3.5 Corsi REL%. He had a cup of coffee in Minnesota with a 4.1 Corsi REL% in 20 games, finishing with a 2.3 on the season. Moulson came back to Buffalo thereafter.
Defender Rasmus Ristolainen led the team in shifts (30) and came in at 22:04 on the ice, five seconds behind leader Tyler Ennis. Ristolainen is getting a lot of ice time as a development move, and it’s starting to pay off – he’s taken 47 shots in 437 minutes over 18 games, when in 2013-14 he took a total of 52 in 650 minutes and 34 games. Ristolainen’s focus on playing scoring defense doesn’t appear to be paying off, though – even as he’s taking more shots, it appears from the statistics that he’s playing weaker defense. He’s taking more but allowing more, as well; although his Corsi For% is rising, it’s still weak (43.9%), and more shots are allowed to the defense while he’s on ice than while he’s off ice (reflected in his -9.0 Corsi REL%).

Linus Ullmark’s minion-themed mask
Linus Ullmark performed well, allowing 2 goals on 28 shots; the Sabres scored once on 26. Ullmark is 4-3, including a difficult November 5 loss to the Lightning. For a rookie, Ullmark’s 2.39 goals against average is solid – it’s better than Chad Johnson‘s 2.67, and Ullmark has a positive goals saved above average; it remains to be seen whether he’ll maintain his relatively high level of performance. So far, that single period against the Lightning seems to be a deviation. Johnson’s been much more variant. From a development perspective, I like seeing Linus start.
Both Buffalo and Dallas are idle tonight. The Sabres’ next game will be on the 19th at St. Louis.
Chad Johnson saves the day – or at least helps a little November 11, 2015
Posted by tomflesher in Hockey, Sports.Tags: Chad Johnson, hockey, hockey-reference.com, Lightning, Sabres
add a comment
The Sabres (7-8-0) picked off the Lightning (7-8-2) last night in Tampa Bay, scoring four goals including one empty-netter by Rasmus Ristolainen with an assist from goalie Chad Johnson. The lanky Albertan started his ninth game of the year and pulled his 2.47 goals against average down with a one-goal complete game. Ristolainen has 3 points and a -2 plus/minus over his last five games, so the empty-net goal was a nice lift for him.
The Lightning outshot the Sabres 31-26, so Johnson’s performance was quite important. In the 2014 season, shots had about a .50 correlation with points and a slightly smaller (.49993) correlation with wins. A quick regression analysis shows that shots on goal have a statistically significant effect on both wins and points: one shot corresponds to about .023 wins and about .045 points, both significant at p < .01. Since the Lightning outshot the Sabres last night, there’s a reason that Johnson’s ‘miraculous’ saves were so key.
A Pythagorean Exponent for the NHL March 17, 2015
Posted by tomflesher in Sports.Tags: hockey, luck, NHL, parameter identification, Pythagorean expectation, Sabres
4 comments
A Pythagorean expectation is a statistic used to measure how many wins a team should expect, based on how many points they score and how many they allow. The name ‘Pythagorean’ comes from the Pythagorean theorem, which measures the distance between the two short sides of a right triangle (the hypotenuse); the name reflects the fact that early baseball-centric versions assumed that Runs^2/(Runs^2 + Runs Allowed^2) should equal the winning percentage, borrowing the exponent of 2 from the familiar Pythagorean theorem (a^2 +b^2 =c^2).
The optimal exponent turned out not to be 2 in just about any sport; in baseball, for example, the optimal exponent is around 1.82. This is found by setting up a function – in the case of the National Hockey League, that formula would be 

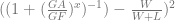
Porting that exponent into the current season, there are a few surprises. First of all, the Anaheim Ducks have been lucky – almost six full wins worth of luck. It would hardly be surprising for them to tank the last few games of the season. Similarly, the Washington Capitals are on the precipice of the playoff race, but they’re over four games below their expected wins. With 11 games to go, there’s a good chance they can overtake the New York Islanders (who are 3.4 wins above expectation), and they’re likely to at least maintain their wild card status.
On the other end, somehow, the Buffalo Sabres are obscenely lucky. The worst team in the NHL today is actually 4 games better than its expectation. Full luck standings as of the end of March 16th are behind the cut.
