Trends in Hat Tricks, 1987-2016 February 9, 2016
Posted by tomflesher in Hockey, Sports.Tags: data visualization, hat trick, hockey, time series
add a comment
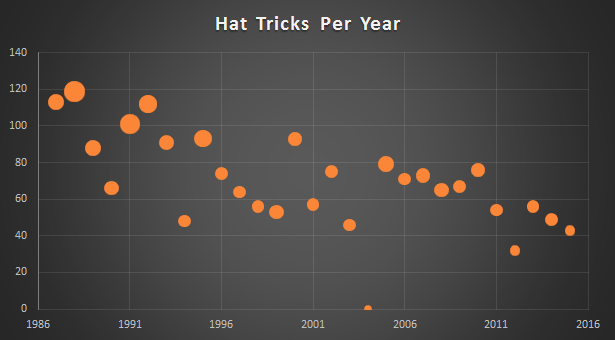
Hat tricks, 1987-2016; bubble size is the number of hat tricks by that year’s leader
Yesterday’s post on hat tricks raised a question – what’s the historical likelihood of a hat trick? Above is a time series of hat tricks by year, with bubble size weighted by the number of hat tricks scored by that year’s leader. The largest bubble is Mario Lemieux with 9 in 1988-89. The largest since 2000 was Jonathan Cheechoo with 5 in 2005-2006.
This looks like a significant downward trend, and it is; with each passing year, and controlling for games played, the expected number of hat tricks declines by about 1.2 (p = .0147). Meanwhile, adding another game to each team’s schedule seems to increase the number of hat tricks in a season by about .85 (p = .00005). There’s no statistical persistence of the numbers (that is, the lag of hat tricks has a coefficient not statistically different from 0). This downward trend is a bit confusing, since at first glance there hasn’t been a visible decrease in the quality of goaltending. That’s probably my next project.
What Happened to Home Runs This Year? December 22, 2010
Posted by tomflesher in Baseball, Economics.Tags: baseball-reference.com, forecasting, home runs, R, regression, standard error, statistics, time series, Year of the Pitcher
1 comment so far
I was talking to Jim, the writer behind Apparently, I’m An Angels Fan, who’s gamely trying to learn baseball because he wants to be just like me. Jim wondered aloud how much the vaunted “Year of the Pitcher” has affected home run production. Sure enough, on checking the AL Batting Encyclopedia at Baseball-Reference.com, production dropped by about .15 home runs per game (from 1.13 to .97). Is that normal statistical variation or does it show that this year was really different?
In two previous posts, I looked at the trend of home runs per game to examine Stuff Keith Hernandez Says and then examined Japanese baseball’s data for evidence of structural break. I used the Batting Encyclopedia to run a time-series regression for a quadratic trend and added a dummy variable for the Designated Hitter. I found that the time trend and DH control account for approximately 56% of the variation in home runs per year, and that the functional form is

with t=1 in 1955, t=2 in 1956, and so on. That means t=56 in 2010. Consequently, we’d expect home run production per game in 2010 in the American League to be approximately

That means we expected production to increase this year and it dropped precipitously, for a residual of -.28. The residual standard error on the original regression was .1092, so on 106 degrees of freedom, so the t-value using Texas A&M’s table is 1.984 (approximating using 100 df). That means we can be 95% confident that the actual number of home runs should fall within .1092*1.984, or about .2041, of the expected value. The lower bound would be about 1.05, meaning we’re still significantly below what we’d expect. In fact, the observed number is about 3.4 standard errors below the expected number. In other words, we’d expect that to happen by chance less than .1% (that is, less than one tenth of one percent) of the time.
Clearly, something else is in play.
