Ichiro’s Body Armor July 8, 2011
Posted by tomflesher in Baseball.add a comment
In the previous post, I looked at Kevin Youkilis and his uncanny ability to be hit by pitches during the regular season. This time, I’d like to go in the opposite direction – who’s started the year with the fewest times hit by a pitch? That’d be Ichiro Suzuki, who’s gone 87 games (he had one night off this year) and 389 plate appearances without being plunked yet this year. Last year he was hit three times in 732 plate appearances, or about 4 in every 1000 plate appearances, for a rate of .004. Assuming his batting and league pitching haven’t changed, that means that any given streak of 389 plate appearances had a probability of occurring of

or roughly one in five. Ichiro has played eleven seasons in the US majors and made 7728 plate appearances, so it’s totally unsurprising that he’d have such a streak without being hit.
In fact, Ichiro is currently on a streak that started on July 7, 2010, of 155 games with at least one plate appearance that don’t involve being plunked. In order to make sense of this, let’s normalize his stats to per-game rather than per-plate-appearance. Over his career, Ichiro has been hit 47 times in 1675 games, meaning that on average he gets hit .028 times per game, or once every 35.6 games. Equivalently, the probability that he does not get hit is (1-.028) = .972. The likelihood of a streak of 155 games, then, is

It’s highly unlikely to occur, but assuming Ichiro is the same batter he always has been, and assuming he plays the remaining 74 games, the likelihood that he won’t be hit at all is

Using the binomial distribution, we can determine that there’s about a 26% chance he’ll be hit once in his next 74 games, and about a 27.4% chance he’ll be hit twice. After that, it drops off sharply. Finally, the probability that he’ll be hit in all 74 games remaining is 1.229e(-115), or so small as to be equivalent to zero for our purposes. (It’s about 1 behind a decimal point and 114 zeros.
Take Your Base July 7, 2011
Posted by tomflesher in Baseball, Economics.Tags: hit batsman, hit batsmen, hit by pitch, Kevin Youkilis, statistics
add a comment
As usual, Kevin Youkilis is getting hit at an alarming rate this year. A quick check of his stats from Baseball Reference shows that from 2004 to 2010, he got hit at about a 2% clip and was intentionally walked about .5% of the time. This year, he’s been hit nine times in 340 plate appearances, for about 2.6% of plate appearances ending in the phrase “Take your base.” He’s only been intentionally walked once, which isn’t out of line from his three IBBs last year. In contrast, he was “only” hit ten times last year, so he’s one away from eclipsing that mark and six away from tying his record 15 times hit (in 2007). Interestingly, Kevin has never been hit in the postseason.
It would be oversimplistic to say that guys who get hit a lot get hit because they’re jerks. There’s a plausible argument that Youkilis’ unorthodox batting stance is responsible for his high rate, and some guys just get hit more often. Crashburn Alley makes the point that getting hit is a legitimate skill, and Plunk Everyone has a truly dizzying array of information about players getting hit. My question, though, is whether it could be the case that Youkilis is hit less often in the postseason because pitchers are more careful.
In 2007, 2008, and 2009, Youkilis made a total of 123 postseason plate appearances. During that time, he was never hit, nor was he intentionally walked. His OBP was .376, compared with a .397 regular-season OBP over those years. It’s possible that he was simply slumping and not seen as a threat.
It’s also possible that Youk’s failure to get hit at a respectable 2% rate (we’d have expected about 2 1/2 plunks) was simply chance. As a quick check, assume that his regular season stats during 2007, 2008, and 2009 represent “true” information, and that the 123 plate appearances he made in the postseasons were all random draws from the same distribution. Since he was hit 43 times in 1834 plate appearances across 2007-09, his true rate would be 2.3% (closer to 2.34, but I rounded down – note that this cuts Youk a little extra slack). Then, 95% of 123-appearance distributions should have hit-by-pitch rates that fall within the window

where se is the standard error, calculated as
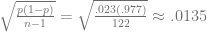
Thus, 95 out of 100 123-appearance runs should fall within the window

Obviously, since there can’t be a negative number of hit batsmen, zero is included in that interval. Youkilis isn’t necessarily being pitched around more effectively in the postseason – he’s just unlucky enough not to get plunked.
Another Balk-Off July 5, 2011
Posted by tomflesher in Baseball.Tags: Aaron Crow, balk-off, balks
add a comment
Kansas City Royals pitcher Aaron Crow ended last night’s game against the Chicago White Sox in an unusual fashion – he balked in the winning run. As David Pinto at Baseball Musings notes, Crow was selected as an All Star this year. Counting last night’s game, he’s pitched 41 1/3 innings in 34 games, finishing 10 of them, with a 1.96 ERA and a K/BB ratio of 2.16 (41/19). It’s his first balk of the season.
Crow came in to start the eighth inning with the Royals leading 3-2. Crow opened by allowing Brent Morel to single, followed by a two-run homer to designated hitter Adam Dunn, dropping behind 4-3. Crow then hopped out of the inning with a pop fly to Paul Konerko, a strikeout to Carlos Quentin, a walk to Alexei Ramirez, and a groundout for Alexis Rios. During the top of the ninth, Eric Hosmer tied it, so when Crow came in for the bottom of the ninth, the score was tied 4-4.
A.J. Pierzynski singled to start the ninth for Ramon Castro, Gordon Beckham bunted him over to second, and he advanced to third on a wild pitch to Mark Teahen (who was pinch hitting for Brent Lillibridge). Teahen struck out, and Juan Pierre walked. Pierre took second on defensive indifference, and while Adam Dunn was at the plate, Crow balked by apparently stepping off the rubber after coming set. That brought Pierzynski home and, of no consequence, Pierre to third.
D.J. Carrasco, of course, balked in Diory Hernandez back on June 16th, with the last balk-off before that coming in May of last year.
At least when Carlos Marmol threw a wild pitch to bring home Jayson Werth, there was no question about what happened.
RBIs with Two Outs July 4, 2011
Posted by tomflesher in Baseball, Economics.Tags: Boone Logan, Daniel Murphy, Hector Noesi, Jason Bay, Mets, Ramiro Pena, RBIs, Scott Hairston, statistics, Subway Series, two-out RBIs, Yankees
add a comment
Sunday’s Subway Series game between the Mets and Yankees ended with a bang – Jason Bay hit a single off Hector Noesi that brought home Scott Hairston. The tenth inning should have been over, but Ramiro Pena committed an error at shortstop that put Daniel Murphy on base for Boone Logan. Hairston’s run was unearned, but no matter – Noesi took the loss and the Mets won the game.
The final score was 3-2, and the interesting thing about the game was that all three of the Mets’ runs came with two outs. (My fiancée, Katie, suggested that this was unusual, and motivated most of the rest of this post.) In fact, so far, the Mets have had 347 RBIs (of 375 runs scored), and 147 of them have come with two outs. That’s about 42.4% of their RBIs. By contrast, only 1070 of 3274 plate appearances – 32.7% – come with two outs. (Less than a third of plate appearances come with two outs because of the double play, among other reasons.) The majority come with no men out (about 34.8%) with the remainder coming with one out. It seems like the high concentration of 2-out RBIs should be explained by the use of the sacrifice bunt, but the Mets have only had 31 sacrifice bunts this season – not nearly enough to account for the difference between 32.7% of plate appearances and 42.4% of RBIs.
Is that pattern common across baseball? So far, there have been 10,037 RBIs in Major League Baseball in the 2011 season. 3686 of them – about 36.7% – came with two outs. Excluding the Mets’ numbers, that’s 3539 out of 9690, or 36.5%. For the National League only, there were 1928 two-out RBIS of 5212 total, or 37%, with 1781 of 4865 (36.6%) of National League RBIs coming with two outs if you exclude the Mets. (Note that I’m defining ‘in the National League’ as ‘in National League parks,’ since what I’m interested in is whether the Mets’ concentration of RBIs can be partially explained by the rules requiring pitchers to bat.)
Assume that the Mets’ RBIs are drawn from the same distribution as all others’. Then, 95% of the time, I’d expect the proportion of RBIs that come with two outs to be within two standard errors of the National League’s proportion, excluding the Mets. (The ‘two standard errors’ comes from the fact that a t-distribution’s critical value for a large number of trials for 95% significance is 1.96. For less than an infinite number, two standard errors is a handy approximation.) For the Mets’ 347 RBIs, the standard error would be

Thus, 95% of the time, the Mets should be within the interval of (.366 – .052, .366+.052), or (.314, .418). Since, again, the Mets’ proportion is .424, the Mets are slightly outside the 95% confidence interval. That’s pretty close, and certainly could happen by chance, but it’s surprising nonetheless. The question then is whether this is due to some sort of strategy employed by the Mets’ management or to some sort of clutch playing ability by the Mets. Again, there’s more data to collect and crunch (as always).
June Wins Above Expectation July 1, 2011
Posted by tomflesher in Baseball, Economics.Tags: Baseball, baseball-reference.com, statistics, wins above expectation
add a comment
Even though I’ve conjectured that team-level wins above expectation are more or less random, I’ve seen a few searches coming in over the past few days looking for them. With that in mind, I constructed a table (with ample help from Baseball-Reference.com) of team wins, losses, Pythagorean expectations, wins above expectation, and Alpha.
Quick definitions:
- The Pythagorean Expectation (pyth%) is a tool that estimates what percentage of games a team should have won based on that team’s runs scored and runs allowed. Since it generates a percentage, Pythagorean Wins (pythW) are estimated by multiplying the Pythagorean expectation by the number of games a team has played.
- Wins Above Expectation (WAE) are wins in excess of the Pythagorean expected wins. It’s hypothesized by some (including, occasionally, me) that WAE represents an efficiency factor – that is, they represent wins in games that the team “shouldn’t” have won, earned through shrewd management or clutch play. It’s hypothesized by others (including, occasionally, me) that WAE represent luck.
- Alpha is a nearly useless statistic representing the percentage of wins that are wins above expectation. Basically, W-L% = pyth% + Alpha. It’s an accounting artifact that will be useful in a long time series to test persistence of wins above expectation.
The results are not at all interesting. The top teams in baseball – the Yankees, Red Sox, Phillies, and Braves – have either negative WAE (that is, wins below expectation) or positive WAE so small that they may as well be zero (about 2 wins in the Phillies’ case and half a win in the Braves’). The Phillies’ extra two wins are probably a mathematical distortion due to Roy Halladay‘s two tough losses and two no-decisions in quality starts compared with only two cheap wins (and both of those were in the high 40s for game score). In fact, Phildaelphia’s 66-run differential, compared with the Yankees’ 115, shows the difference between the two teams’ scoring habits. The Phillies have the luxury of relying on low run production (they’ve produced about 78% of the Yankees’ production) due to their fantastic pitching. On the other hand, the Yankees are struggling with a 3.53 starters’ ERA including Ivan Nova and AJ Burnett, both over 4.00, as full-time starters. The Phillies have three pitchers with 17 starts and an ERA under 3.00 (Halladay, Cliff Lee, and Cole Hamels) and Joe Blanton, who has an ERA of 5.50, has only started 6 games. Even with Blanton bloating it, the Phillies’ starer ERA is only 2.88.
That doesn’t, though, make the Yankees a badly-managed team. In fact, there’s an argument that the Yankees are MORE efficient because they’re leading their league, just as the Phillies are, with a much worse starting rotation, through constructing a team that can balance itself out.
That’s the problem with wins above expectation – they lend themselves to multiple interpretations that all seem equally valid.
Tables are behind the cut. (more…)
Don Kelly, Utility King June 30, 2011
Posted by tomflesher in Baseball.Tags: Angel Pagan, Austin Jackson, Carlos Beltran, David Purcey, Don Kelly, Jason Bay, Justin Turner, Mets, Mike McCoy, position players pitching, Ronnie Paulino, Roy Halladay, Scott Hairston, Spectrum Club, Super utility dervish, Tigers, utility pitchers, utility player, utilityman, Wilson Valdez
1 comment so far
Super utility dervish Don Kelly is this year’s second inductee into the prestigious* Spectrum Club, which loyal readers if any will recognize as the group of players who have played both pitcher and designated hitter in a given season. Kelly pitched a perfect third of an inning (for those keeping score at home, that’s one out) against the Mets last night during a 16-9 Tigers loss.
Kelly’s lifetime pitching statistics: 0.1 IP, 0 R, 0 H, 0 E, 0 HR, 0 BB, 0 K, 1 BF. That batter was Scott Hairston, who flied out to Austin Jackson at center.
Kelly came in after David Purcey, the Tigers’ last arm in the bullpen, pitched the last out of the eighth and the first two of the ninth. In his one inning, Purcey gave up five hits, four runs (all of them earned), two walks (one intentional), and no strikeouts. Purcey’s ninth inning started promisingly when Justin Turner grounded out and Carlos Beltran flied out, but David then gave up a double to catcher Ronnie Paulino, walked Jason Bay, and then allowed Angel Pagan to double, scoring Paulino. At that point, Jim Leyland called on Kelly, who took care of Hairston to end the inning.
That makes three utility pitchers thus far this year. Of the position players who pitched, Wilson Valdez, Mike McCoy and Don Kelly have each played at least three non-pitching positions. Valdez has played at second base, third base, and shortstop; McCoy has played second, third, shortstop, center field, and left field; and Kelly has played first, third, left, center, and right. They’re three of the four pitchers with fifty or more plate appearances. (Roy Halladay is the fourth, with exactly 50 PA this year.)
Over the course of his career, Kelly has been a utility ubermensch, playing every position except catcher. As a lifetime .242/.287/.341 hitter, Kelly needs to be versatile defensively to keep himself working. That’s essentially the same way Mike McCoy keeps his job. Kelly had never pitched professionally before.
*not a guarantee
Justin Turner Takes One For The Team June 23, 2011
Posted by tomflesher in Baseball, Economics.Tags: Athletics, Brad Ziegler, Charlie Morton, Dane Sardinha, hit by pitch, Jeff Francoeur, Justin Turner, Mariano Rivera, Mets, Oakland As
add a comment
The Mets’ Justin Turner quite literally took one for the team last night when he wasn’t trying to get hit, but, oops, managed to get plunked in the bottom of the 13th inning with the bases loaded. Brad Ziegler was the losing pitcher for Oakland. It was the first game-ending hit by pitch since last year, when Mariano Rivera nailed Jeff Francoeur for the loss in a September game.
In 185 plate appearances this year, Turner has been hit three times. The other two were both by Pittsburgh Pirates pitcher Charlie Morton, eleven days apart; Morton is not especially known for hitting batters, since he, too, has only been involved in three hit batsmen this year. (The third plunking was Dane Sardinha.) It was the Mets’ only go-ahead HBP this year, and the only one of this year’s six go-ahead hit batsmen to occur in extra innings.
Turner has a way about him. He’s hit ten go-ahead RBIs this year (and yes, a hit by pitch that forces in a run is an RBI), which accounts for a little over ten percent of the Mets’ 95 go-ahead RBIs. Only Carlos Beltran, with 13, has more. It’s also the Mets’ only game-ending RBI this year. I guess Turner will take what he can get.
Quickie: Mike McCoy, Utility Pitcher du Jour June 13, 2011
Posted by tomflesher in Baseball.Tags: Blue Jays, Mike McCoy, position players pitching, Spectrum Club
add a comment
The Blue Jays used seven pitchers in their 16-4 loss to the Red Sox on Saturday. One of those was utility player Mike McCoy, who pitched his first major league inning in the ninth. He managed no strikeouts but also no walks, and finished with an impressive perfect inning.
McCoy is unusual among position players who pitch in that he’s pitched before professionally. Most recently, he finished a AAA game for Colorado in 2009, but he’d also finished two games in A – one in 2004 and one in 2005. His pitching history in the minors is here.
McCoy is also the first inductee into the prestigious* 2011 Spectrum Club, which is a group of players who have both pitched and played designated hitter in the same season, showing off the full spectrum of their abilities from purely offensive to purely defensive. He’s made a few appearances as a pinch runner for the DH, but back on April 6, he played a complete game as the designated hitter and so became this year’s first member.
Of course, for position players pitching, nothing beats Wilson Valdez, Utility Pitcher Extraordinaire, or Andy Marte in the Best Game Ever, but if you’re especially curious, check out last year’s Utility Pitcher Roundup.
*not a guarantee
Cheap Wins So Far June 7, 2011
Posted by tomflesher in Baseball.Tags: Cheap Wins
add a comment
Chad Billingsley‘s cheap win the other night on a tiny 35 game score, matched by Mat Latos‘ 48 game score cheap win the same night, led me to think a little about cheap wins in general. Then, Brian Matusz beat Oakland and Max Scherzer eked out a win over the Rangers (both last night) and I knew I had to do an entry.
I’ve talked about Cheap Wins before. They use Bill James’ Game Score stat, which gives a starting pitcher 50 points and then adds or subtracts points for hits, runs, walks, and so on. A quality start is defined as a game score of 50 or above. A Cheap Win is a pitcher win in which the pitcher didn’t have a quality start. That is, it’s a game in which the pitcher has both a Win and a game score of 49 or less.
So far this year, the Rockies are at the top of the leaderboard with 7 Cheap Wins. The Cardinals, the White Sox and the Yankees are backing them up with 5 each. That’s not entirely surprising – the Yankees and the Cardinals are known to be high-scoring teams. Individually, Jeremy Hellickson leads the Majors with 3 Cheap Wins for the Rays, followed by a spate of players (including Carlos Zambrano, Edinson Volquez, Mark Buehrle and AJ Burnett) with 2 each.
It’s worth keeping an eye on Cheap Wins and their converse, Tough Losses, as a way of gauging the relative quality of pitchers. A pitcher with a high proportion of Cheap Wins is relying a lot on his team to buoy him through difficult games, while a pitcher with a few here and there is probably getting himself through the tough spots.
Chad Billingsley’s Home Run June 6, 2011
Posted by tomflesher in Baseball.Tags: Casey Blake, Chad Billingsley, Diamondbacks, Dodgers, James Loney, Keith Osik, Matt Kemp, Nationals, Nick Swisher, Pitchers batting, position players pitching, Rays, Reds, Travis Wood, Yankees, Zach Duke
add a comment
Chad Billingsley had what was by all accounts an unremarkable start on the mound last night: 5 IP, 8 H, 4 R, all of them earned, 3 walks, 3 strikeouts, 1 HBP. Considering that the Dodgers have seven tough losses already (only the Rays and the Nationals have more), this would ordinarily be a short entry commenting on how Billingsley needs some work.
Actually, scratch that. I wouldn’t make that entry – the folks over at Mike Scioscia’s Tragic Illness would.
Billingsley managed to earn a mention last night by hitting the second home run of his career (solo in the second) and going 2 for 2 with a walk. Billingsley’s Win Probability Added (WPA) from the plate was a team-leading .215 (Matt Kemp was second with .168). Of course, he evened that out with actually subtracting WPA as a pitcher. Still, his walk in the third forced Casey Blake in for a second RBI, and his double in the fifth brought James Loney home and ultimately pulled Reds starter Travis Wood out of the game.
Oddly, Wood himself managed a three-RBI night back on May 9, as did the Diamondbacks’ Zach Duke on May 28. Like Billingsley, both of them took the win in those games.
The most stylish home runs by pitchers happen when the player doesn’t even know he’s a pitcher, though – on April 13, 2009, Nick Swisher hit a home run in the top of the fourth inning while playing first base and then was called on to pitch the bottom of the 8th in a 15-5 loss to the Rays. He’s the only player in the last 10 years to start the game as a position player, hit a home run, and pitch. Admittedly, that’s a weird set of conditions. Luckily, there’s another instance that almost fits, so I don’t feel like I’m cheating. Keith Osik didn’t start on May 20, 2000, but came in as part of a triple-switch in the top of the 8th to play third base. Osik hit a two-run homer to bring Mike Benjamin home in the bottom of the 8th, then gave up 5 earned runs on 5 hits in the top of the 9th.
Hopefully Billingsley will repeat his performance at the plate and will continue cleaning up on the mound. Last night was his first Cheap Win of the year, and he already has two Tough Losses. Not a bad showing as far as ability goes.
