A Pythagorean Exponent for the NHL March 17, 2015
Posted by tomflesher in Sports.Tags: hockey, luck, NHL, parameter identification, Pythagorean expectation, Sabres
trackback
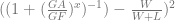
A Pythagorean expectation is a statistic used to measure how many wins a team should expect, based on how many points they score and how many they allow. The name ‘Pythagorean’ comes from the Pythagorean theorem, which measures the distance between the two short sides of a right triangle (the hypotenuse); the name reflects the fact that early baseball-centric versions assumed that Runs^2/(Runs^2 + Runs Allowed^2) should equal the winning percentage, borrowing the exponent of 2 from the familiar Pythagorean theorem (a^2 +b^2 =c^2).
The optimal exponent turned out not to be 2 in just about any sport; in baseball, for example, the optimal exponent is around 1.82. This is found by setting up a function – in the case of the National Hockey League, that formula would be 

Porting that exponent into the current season, there are a few surprises. First of all, the Anaheim Ducks have been lucky – almost six full wins worth of luck. It would hardly be surprising for them to tank the last few games of the season. Similarly, the Washington Capitals are on the precipice of the playoff race, but they’re over four games below their expected wins. With 11 games to go, there’s a good chance they can overtake the New York Islanders (who are 3.4 wins above expectation), and they’re likely to at least maintain their wild card status.
On the other end, somehow, the Buffalo Sabres are obscenely lucky. The worst team in the NHL today is actually 4 games better than its expectation. Full luck standings as of the end of March 16th are behind the cut.
| Team | Lucky Wins |
| Anaheim Ducks | 5.9 |
| New York Rangers | 0.1 |
| St. Louis Blues | 0.8 |
| Tampa Bay Lightning | -1.2 |
| Montreal Canadiens | 1.9 |
| Nashville Predators | 1.2 |
| New York Islanders | 3.4 |
| Pittsburgh Penguins | -0.3 |
| Chicago Blackhawks | -1.6 |
| Detroit Red Wings | 0.6 |
| Washington Capitals | -4.4 |
| Minnesota Wild | -1.3 |
| Boston Bruins | -0.4 |
| Vancouver Canucks | 3.2 |
| Los Angeles Kings | -3.5 |
| Calgary Flames | -1.3 |
| Winnipeg Jets | -1.5 |
| Ottawa Senators | -3.8 |
| Florida Panthers | 1.2 |
| San Jose Sharks | -0.5 |
| Colorado Avalanche | -0.7 |
| Dallas Stars | -1.1 |
| Philadelphia Flyers | -3.2 |
| New Jersey Devils | -0.7 |
| Columbus Blue Jackets | 2.8 |
| Toronto Maple Leafs | -1.3 |
| Carolina Hurricanes | -2.4 |
| Arizona Coyotes | 2.7 |
| Edmonton Oilers | -2.1 |
| Buffalo Sabres | 4.0 |

[…] goals. I was curious how much noisier, so I fired up R using the 2014 data and decided to update my post from earlier this year about the optimal Pythagorean exponent for the NHL. In it, I set up three minimization problems, […]
[…] is a plot of NHL teams’ Pythagorean luck through games played on December 10. The bubbles are scaled to the number of wins each team […]
[…] Luck numbers through the All-Star Break follow. […]
[…] determine this exponent, we need to minimize e in the below function (displayed in this article) where each other figure is team specific and shootout goals are […]