How has hitting changed this year? Evidence from the first half of 2017 August 22, 2017
Posted by tomflesher in Baseball.Tags: Baseball, binomial distribution, home runs, MLB, probability, Stuff Gary Cohen Says
3 comments
It’s no secret that MLB hitters are hitting more home runs this year. In June, USA Today’s Ted Berg called the uptick “so outrageous and so unprecedented” as to require additional examination, and he offered a “juiced” ball as a possibility (along with “juiced” players and statistical changes to players’ approaches). DJ Gallo noted a “strange ambivalence” toward the huge increase in home runs, and June set a record for the most home runs in a month. Neil Greenberg makes a convincing case that the number of homers is due to better understanding of the physics of hitting.
How big a shift are we talking about here? Well, take a look at the numbers from 2016’s first half. (That’s defined as games before the All-Star Game.) That comprises 32670 games and 101450 plate appearances. In that time period, hitters got on base at a .323 clip. About 65% of hits were singles, with 19.6% doubles, 2.09% triples, and 13.2% home runs. Home runs came in about 3.04% of plate appearances (3082 home runs in 101450 plate appearances).

Using 2016’s rate, 2017’s home run count is basically impossible.
Taking that rate as our prior, how different are this year’s numbers? For one, batters are getting on base only a little more – the league’s OBP is .324 – but hitting more extra-base hits every time. Only 63.7% of hits in the first year were singles, with 19.97% of hits landing as doubles, 1.78% triples, and 14.5% home runs. There were incidentally, more homers (3343) in fewer plate appeances (101269). Let’s assume for the moment that those numbers are significantly different from last year – that the statistical fluctuation isn’t due to weather, “dumb luck,” or anything else, but has to be due to some internal factor. There weren’t that many extra hits – again, OBP only increased by .001 – but the distribution of hits changed noticeably. Almost all of the “extra” hits went to the home run column, rather than more hits landing as singles or doubles.
In fact, there were more fly balls this year – the leaguewide grounder-to-flyer ratio fell from .83 in 2016 to .80 this year. That still doesn’t explain everything, though, since the percentage of fly balls that went out of the park rose from 9.2% to 10%. (Note that those are yearlong numbers, not first-half specific.) Not only are there more fly balls, but more of them are leaving the stadium as home runs. The number of fly balls on the infield has stayed steady at 12%, and although there are slightly more walks (8.6% this year versus 8.2% last year), the strikeout rate rose by about the same number (21.5% this year, 21.1% last year).
Using last year’s rate of 3082 homers per 101450 plate appearances, I simulated 100,000 seasons each consisting of 101269 plate appearances – the number of appearances made in the first half of 2017. To keep the code simple, I recorded only the number of home runs in each season. If the rates were the same, the numbers would be clustered around 3077. In fact, in those 100,000 seasons, the median and mean were both 3076, and the distribution shown above has a clear peak in that region. Note in the bottom right corner, the distribution’s tail basically disappears above 3300; in those 100,000 seasons, the most home runs recorded was 3340 – 3 fewer than this year’s numbers. In fact, the probability of having LESS than 3343 home runs is 0.9999992. If everything is the same as last year, the probability of this year’s home runs occurring simply by chance is .0000008, or roughly 8 in 10 million.
Are extra-innings contests evenly matched? (Mets Game 14) April 21, 2016
Posted by tomflesher in Baseball, Economics.Tags: extra innings, Mets game 14, probability, statistics
add a comment
The Mets lost to the Phillies in 11 innings last night. That was a surprising result – based on the run scoring in the first two games, the Pythagorean expectation for the same Mets team facing the same Phillies team would have been around 95.5%. Even going into extra innings seemed to be a stretch with Bartolo Colon pitching. Plus, the Phillies were in the bottom of the league in extra innings last year.
Addison Reed blew his first save of the year when he allowed a single to Peter Bourjos that scored David Lough. Despite strong performances from Antonio Bastardo and Jim Henderson, Hansel Robles allowed a double, a wild pitch, and a single that brought Freddy Galvis home.
Once we hit the tenth inning, it’s evidence that the teams are evenly matched, right? Not necessarily. in 2015, there were 212 extra-innings games. The home team won 111 of them, about 52.4%. That’s obviously higher than expected, but keep in mind that if this were a fifty-fifty coin flip we’d expect at least 111 wins around 22.5% of the time. Where it gets interesting is that the home team has (with the exception of 2014) consistently won over half those games, but that the more games that are played, the better visitors do. Since 2006, 2144 extra-innings games have been played with teams winning 1130 of them for a .527 winning percentage; that’s something that, if this truly is a 50-50 proposal, should only happen by chance 0.6% of the time.
| Year | G | W | L | perc |
| 2006 | 185 | 105 | 80 | 0.568 |
| 2007 | 220 | 117 | 103 | 0.532 |
| 2008 | 208 | 108 | 100 | 0.519 |
| 2009 | 195 | 106 | 89 | 0.544 |
| 2010 | 220 | 116 | 104 | 0.527 |
| 2011 | 237 | 134 | 103 | 0.565 |
| 2012 | 192 | 96 | 96 | 0.500 |
| 2013 | 243 | 125 | 118 | 0.514 |
| 2014 | 232 | 112 | 120 | 0.483 |
| 2015 | 212 | 111 | 101 | 0.524 |
| Total | 2144 | 1130 | 1014 | 0.527 |
One other result gives us pause: from 2006-2015, 24297 games were played and the home team won 13171 of them. That’s a considerable home field advantage, since all teams play half their games on the road and half at home. That corresponds to a .542 win probability for any home team. If that, rather than .500, is the expected win rate for a home team, then teams perform significantly worse in extra innings.
In other words, though the home team still has an advantage, that advantage shrinks once we hit the tenth inning.
The Mets are idle tonight. They’ll pick up in Atlanta on Friday.
Home Field Advantage Again July 12, 2011
Posted by tomflesher in Baseball, Economics.Tags: attendance effects, Baseball, Giants, home field advantage, linear regression, probability, probit, statistics
add a comment
In an earlier post, I discussed the San Francisco Giants’ vaunted home field advantage and came to the conclusion that, while a home field advantage exists, it’s not related to the Giants scoring more runs at home than on the road. That was done with about 90 games’ worth of data. In order to come up with a more robust measure of home field advantage, I grabbed game-by-game data for the national league from the first half of the 2011 season and crunched some numbers.
I have two questions:
- Is there a statistically significant increase in winning probability while playing at home?
- Is that effect statistically distinct from any effect due to attendance?
- If it exists, does that effect differ from team to team? (I’ll attack this in a future post.)
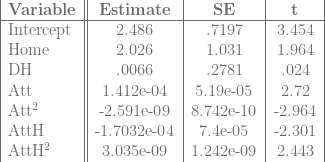
Methodology: Using data with, among other things, per-game run totals, win-loss data, and attendance, I’ll run three regressions. The first will be a linear probability model of the form

where 

As such, I’ll also run a Probit model of the same equation to avoid problems caused by the simplicity of the linear probability model.
Finally, just as a sanity check, I’ll run the same regression, but for runs, instead of win probability. Since runs aren’t binary, I’ll use ordinary least squares, and also control for the possibility that games played in American League parks lead to higher run totals by controlling for the designated hitter:

Since runs are a factor in winning, I have the same expectations about the signs of the beta values as above.
Results:
Regression 1 (Linear Probability Model):

So, my prediction about the attendance betas was incorrect, but only because I failed to account for the squared terms. The effect from home attendance increases as we approach full attendance; the effect from road attendance decreases at about the same rate. There’s still a net positive effect.
Regression 2 (Probit Model):

Note that in both cases, there’s a statistically significant 
Finally, the regression on runs:
Regression 3 (Predicted Runs):
Again, with runs, there is a statistically significant effect from being at home, and a variety of possible attendance effects. For low attendance values, the Home effect is probably swamped by the negative attendance effect, but for high attendance games, the Home effect probably outweighs the attendance effect or the attendance effect becomes positive.
Again, the Home effect is statistically significant no matter which model we use, so at least in the National League, there is a noticeable home field advantage.
Mariano’s Walk-Off Beanball September 12, 2010
Posted by tomflesher in Baseball.Tags: As, David Robertson, Derek Jeter, hit batsman, hit by pitch, Jeff Francoeur, Jose Molina, Lenny DiNardo, Mariano Rivera, Nelson Cruz, odds, probability, Rangers, Yankees
add a comment
Mariano Rivera did something strange tonight: He plunked in the winning run. He hit Jeff Francoeur of the Texas Rangers to force in Nelson Cruz for the winning run in extra innings. It was his fourth hit batsman of the year and only his third loss.
A walk-off beaning requires an extraordinary set of circumstances. First of all, like all walk-off plays, it requires the home team to be at bat in the bottom of the inning. In this case, it was in extra innings rather than the bottom of the 9th. It additionally requires a tied game in the bottom of said inning. Finally, it requires the bases to be loaded when the plunking occurs.
This is all magnified by the face that Rivera does not ordinarily load the bases. Assuming his 2010 OBP against (.214) held, the probability the bases being loaded with two outs or fewer is:

Then, if that situation occurs, we still have to deal with the unlikely event of Mariano hitting a player with a pitch. Before this evening, Mo had hit three batters in 196 plate appearances, for a rate of about .0153. Thus, the probability of Mariano Rivera hitting a batter with a pitch after having loaded the bases is

That means that in 10,000 innings, we would expect that to occur about 4 times, assuming that Mariano wasn’t removed after having walked the bases (which would obviously introduce some bias).
Oddly, the last walk-off hit by pitch also involved the Yankees, albeit on the other side, way back on July 19 of 2008. That night, the A’s’ Lenny DiNardo hit Jose Molina with a pitch to force in Derek Jeter, again in extra innings. David Robertson grabbed the win that night.
Teixeira and Cano: Picking up slack? August 5, 2010
Posted by tomflesher in Baseball, Economics.Tags: A-Rod, Alex Rodriguez, binomial distribution, Mark Teixeira, probability, Robinson Cano, statistics, Yankees
1 comment so far
Michael Kaye, the YES broadcaster for the Yankees, often pointed out between July 22 and August 4 that the Yankees were turning up their offense to make up for Alex Rodriguez‘s lack of home run production. That seems like it might be subject to significant confirmation bias – seeing a few guys hit home runs when you wouldn’t expect them to might lead you to believe that the team in general has increased its production. So, did the Yankees produce more home runs during A-Rod’s drought?
During the first 93 games of the season, the Yankees hit 109 home runs in 3660 plate appearances for rates of 1.17 home runs per game and .0298 home runs per plate appearance. From July 23 to August 3, they hit 17 home runs in 451 plate appearances over 12 games for rates of 1.42 home runs per game and .0377 home runs per plate appearances. Obviously those numbers are quite a bit higher than expected, but can it be due simply to chance?
Assume for the moment that the first 93 games represent the team’s true production capabilities. Then, using the binomial distribution, the likelihood of hitting at least 17 home runs in 451 plate appearances is

The cumulative probability is about .868, meaning the probability of hitting 17 or fewer home runs is .868 and the probability of hitting more than that is about .132. The probability of hitting 16 or fewer is .805, which means out of 100 strings of 451 plate appearances about 81 of them should end with 16 or fewer plate appearances. This is a perfectly reasonable number and not inherently indicative of a special performance by A-Rod’s teammates.
Kaye frequently cited Mark Teixeira and Robinson Cano as upping their games. Teixeira hit 18 home runs over the first 93 games and made 423 plate appearances for rates of .194 home runs per game and .0426 home runs per plate appearance. From July 23 to August 3, he had 5 home runs in 12 games and 54 plate appearances for rates of .417 per game and .0926. That rate of home runs per plate appearance is about 8% likely, meaning that either Teixeira did up his game considerably or he was exceptionally lucky.
Cano played 92 games up to July 21, hitting 18 home runs in 400 plate appearances for rates of .196 home runs per game and .045 per plate appearance. During A-Rod’s drought, he hit 3 home runs in 50 plate appearances over 12 games for rates of .25 and .06. That per-plate-appearance rate is about 39% likely, which means we don’t have enough evidence to reject the idea that Cano’s performance (though better than usual) is just a random fluctuation.
It will be interesting to see if Teixeira slows down as a home-run hitter now that Rodriguez’s drought is over.
Is A-Rod’s Performance Different? August 3, 2010
Posted by tomflesher in Baseball, Economics.Tags: A-Rod, Alex Rodriguez, Choke Index, OBP, p-value, probability, SLG, statistics, t-value, Yankees
1 comment so far
In games between milestone home runs, is Alex Rodriguez’ hitting similar to other times? (This is all a very polite way of asking, “Does A-Rod choke?”) It’s difficult to answer, because there’s so little data about those milestone home runs. A-Rod, though, has some statistically improbable results and it would be interesting to look at it a bit more closely.
Over 2008-2009, Alex played in 262 games and had 1129 plate appearances with 281 hits, 65 home runs, a triple:double ratio of 1:50, an OBP of .397, and a SLG of .553. His OBP has a margin of error of .0146, so we can be 95% confident that over those years his baseline production would be somewhere between .368 and .426 and absent any time or age effect that is the range in which A-Rod should produce for any given period.
Two recent milestone home runs come to mind as examples of Rodriguez’s reputed choking. First, the stretch between home run #499 and #500 was 8 games and 36 plate appearances. (I’m intentionally ignoring extra plate appearances on the days he hit #499 and #500.) During that time, Alex had an OBP of only .306. That’s a difference of .091 over 36 plate appearances and that performance has a standard error of about .078 when compared with his regular performance, implying a t-value of about 1.16. With 35 degrees of freedom, Texas A&M’s t Calculator gives a p-value of about .127, so this difference is marginally within the realm of chance. (The usual cutoff for significance would be .05.)
A-Rod hit his last home run on July 22. Discounting the plate appearances after his last home run, he’s played in 11 games with a paltry .255 OBP and .238 SLG over 47 plate appearances. His .255 OBP has a difference of about .142 and a standard error of about .064. That implies a t-value of about 2.21, with a p-value of about .016. That is, the probability of this difference occurring by chance is less than 2%. That gives us one result as close to significant and one as probably significant.
As a side note, A-Rod’s Choke Index continues to rise. He’s gone 48 plate appearances without a home run, and at a rate of .055 home runs per plate appearance the probability of that occurring by chance is about .066. That leaves his Choke Index at .934.
The Choke Index August 1, 2010
Posted by tomflesher in Baseball.Tags: 599 home runs, 600 home runs, A-Rod, Alex Rodriguez, Barry Bonds, Choke Index, Gary Sheffield, probability, statistics
3 comments
It’s been quite a while since Alex Rodriguez hit Home Run #599 – nine days since July 22, but more quantifiably, 42 plate appearances. Just how much of a slump is he in? I’d like to propose a quantifiable answer: the Choke Index.
From 2000 to 2009, A-Rod was hitting approximately .064 home runs per plate appearance. In 2008 he hit .059 and in 2009 he hit .056, so it’s probably much fairer to use a slightly lower rate. I’m going to make the assumption that Rodriguez’s true production is about .055 home runs per plate appearance, since he exhibited a downward trend and his 2010 production has been very low. (It also cuts him some additional slack in the Choke Index.)
Simply, we should assume that A-Rod’s failure to produce is merely the result of chance, and not due to choking or media distraction or even Rodriguez’s discomfort with the special chipped baseballs. (A better man than I would call this the Numbered Ball Effect.) Then, we should see how likely that is.
At .055 home runs per plate appearance, the likelihood of going 42 plate appearances without a home run is 

A-Rod’s Choke Index between #499 and #500 was about .877. This is a man who doesn’t handle milestones well.
Another example was Gary Sheffield in 2009, when he was attempting to hit his 500th home run. In the previous two years, he hit approximately .041 home runs per plate appearance. Much was made of Sheffield’s trouble hitting #500, but since he was hitting almost exclusively as a pinch hitter, he simply didn’t have many opportunities. Between his final plate appearance on September 26 of 2008 and his only plate appearance on April 17 of 2009, Sheffield went 21 plate appearances without hitting a homer. That gives him a choke index of .556.
Barry Bonds, meanwhile, was hitting .065 home runs per plate appearance in the seasons prior to his record-breaking home run #756. #755 was hit in Bonds’ first plate appearance on August 4, 2007. Bonds made 3 more plate appearances, all walks, in that game. He hit #756 in his third plate appearance only three days later on August 7. He had August 5 off and made 4 plate appearances on August 6, meaning that Bonds went 9 plate appearances between home runs, giving him a choke index of .454.
Rodriguez will hit his 600th home run eventually, but it’s getting painful to watch.
The Best Game Ever July 30, 2010
Posted by tomflesher in Baseball.Tags: 600 home runs, Alex Rodriguez, Andy Marte, Chan Ho Park, Colin Curtis, designated hitter, Frank Hermann, Gabe Kapler, Indians, Jess Todd, Joe Girardi, Joe Smith, losing DH, Marcus Thames, Mitch Talbot, Nick Swisher, position players pitching, probability, Rafael Perez, statistics, Tony Sipp, Yankees
2 comments
Two of my favorite things about baseball happened during tonight’s game between the Yankees and the Indians.
First of all, in the top of the ninth inning, corner infielder Andy Marte pitched for the Indians. Marte pitched a perfect ninth and coincidentally struck out Nick Swisher, who was brought in to pitch for the Yankees in a similar situation last year and struck out Gabe Kapler of the Tampa Bay Rays. I can’t promise it’s true, but I think that puts Swisher at the top of the list for involvement in position player pitcher strikeouts.
Marte’s presence was necessary because the Indians used seven other pitchers. Starter Mitch Talbot went only two innings, and the Indians got another two out of Rafael Perez. Frank Hermann took the loss for the Indians during his 1 1/3 innings. Tony Sipp pitched another 1 1/3, and Joe Smith managed to give up four earned runs in 1/3 of an inning before being removed for Jess Todd for an inning. In the bottom of the 9th, Marte was all the Indians had left.
Not to be outdone, Joe Girardi gave up his designated hitter by moving his DH – funnily enough, it was Swisher – into right field as part of a triple switch. Swisher moved to right field; Colin Curtis moved from right field to left field; Marcus Thames moved from left field to third base; finally, pitcher Chan Ho Park was put into the batting order in place of Alex Rodriguez, who came out of the game.
Finally, A-Rod is up to 33 plate appearances without a home run. Assuming his standard rate of .064 home runs per plate appearance, the likelihood of this happening by chance is 
The 600 Home Run Almanac July 28, 2010
Posted by tomflesher in Baseball, Economics.Tags: 600 home runs, A-Rod, Alex Rodriguez, Babe Ruth, Barry Bonds, Baseball, baseball-reference.com, Hank Aaron, Jim Thome, Ken Griffey Jr., Manny Ramirez, probability, Sammy Sosa, statistics, Willie Mays
2 comments
People are interested in players who hit 600 home runs, at least judging by the Google searches that point people here. With that in mind, let’s take a look at some quick facts about the 600th home run and the people who have hit it.
Age: There are six players to have hit #600. Sammy Sosa was the oldest at 39 years old in 2007. Ken Griffey, Jr. was 38 in 2007, as were Willie Mays in 1969 and Barry Bonds in 2002. Hank Aaron was 37. Babe Ruth was the youngest at 36 in 1931. Alex Rodriguez, who is 35 as of July 27, will almost certainly be the youngest player to reach 600 home runs. If both Manny Ramirez and Jim Thome hang on to hit #600 over the next two to three seasons, Thome (who was born in August of 1970) will probably be 42 in 2012; Ramirez (born in May of 1972) will be 41 in 2013. (In an earlier post that’s when I estimated each player would hit #600.) If Thome holds on, then, he’ll be the oldest player to hit his 600th home run.
Productivity: Since 2000 (which encompasses Rodriguez, Ramirez, and Thome in their primes), the average league rate of home runs per plate appearances has been about .028. That is, a home run was hit in about 2.8% of plate appearances. Over the same time period, Rodriguez’ rate was .064 – more than double the league average. Ramirez hit .059 – again, over double the league rate. Thome, for his part, hit at a rate of .065 home runs per plate appearance. From 2000 to 2009, Thome was more productive than Rodriguez.
Standing Out: Obviously it’s unusual for them to be that far above the curve. There were 1,877,363 plate appearances (trials) from 2000 to 2009. The margin of error for a proportion like the rate of home runs per plate appearance is

Ordinarily, we expect a random individual chosen from the population to land within the space of 

That means that all three of the players are well without that confidence interval. (However, it’s likely that home run hitting is highly correlated with other factors that make this test less useful than it is in other situations.)
Alex’s Drought: Finally, just how likely is it that Alex Rodriguez will go this long without a home run? He hit his last home run in his fourth plate appearance on July 22. He had a fifth plate appearance in which he doubled. Since then, he’s played in five games totalling 22 plate appearances, so he’s gone 23 plate appearances without a home run. Assuming his rate of .064 home runs per plate appearance, how likely is that? We’d expect (.064*23) = about 1.5 home runs in that time, but how unlikely is this drought?
The binomial distribution is used to model strings of successes and failures in tests where we can say clearly whether each trial ended in a “yes” or “no.” We don’t need to break out that tool here, though – if the probability of a home run is .064, the probability of anything else is .936. The likelihood of a string of 23 non-home runs is

It’s only about 22% likely that this drought happened only by chance. The better guess is that, as Rodriguez has said, he’s distracted by the switching to marked baseballs and media pressure to finally hit #600.
Grand Slam, First Career At-Bat June 15, 2010
Posted by tomflesher in Baseball.Tags: batting order position, Daniel Nava, first career at-bat, grand slam, Jeremy Hermida, Kevin Kouzmanoff, probability, Red Sox
add a comment
On Saturday, Daniel Nava hit a grand slam in his first at-bat (hitting ninth for Boston). Needless to say, the odds against this are exceedingly long.
So far in 2010, there have been 1786 home runs hit in 73122 Major League Baseball plate appearances, for a rate of about .024 home runs per plate appearance. The American League has a league on-base percentage of .331 and the National League’s OBP is .329. That means that the prospect of any plate appearance ending in an out is (using .330 as the average OBP) .670. The likelihood of the bases being loaded at any point in an inning is the sum of three probabilities – three on base with 0, 1, or 2 outs.
![p[bases loaded, 0 out] = .33*.33*33 = .036](https://s0.wp.com/latex.php?latex=p%5Bbases+loaded%2C+0+out%5D+%3D+.33%2A.33%2A33+%3D+.036&bg=ffffff&fg=666666&s=0&c=20201002)
![p[bases loaded, 1 out] = .33*.33*.33*.67 = .024](https://s0.wp.com/latex.php?latex=p%5Bbases+loaded%2C+1+out%5D+%3D+.33%2A.33%2A.33%2A.67+%3D+.024&bg=ffffff&fg=666666&s=0&c=20201002)
![p[bases loaded, 2 out] = .33*.33*.33*.67*.67 = .016](https://s0.wp.com/latex.php?latex=p%5Bbases+loaded%2C+2+out%5D+%3D+.33%2A.33%2A.33%2A.67%2A.67+%3D+.016&bg=ffffff&fg=666666&s=0&c=20201002)
![p[bases loaded] = .036 + .024 + .016 = .076](https://s0.wp.com/latex.php?latex=p%5Bbases+loaded%5D+%3D+.036+%2B+.024+%2B+.016+%3D+.076&bg=ffffff&fg=666666&s=0&c=20201002)
Note that this slightly overestimates the probability, since it ignores the likelihood of an extra-base hit. Obviously an extra-base hit would increase the chance that three people made it to base but one or more scored, leaving the bases unloaded.
Now, with a home run probability of .024, and a bases loaded probability of .076, the (again, slightly overestimated) probability of a grand slam is about .002, or .2%. That is, about one in every 500 at-bats should be a grand slam.
Since 1920, there have been only 10 people who have hit a home run and had 4 or more RBIs in their first game. The list is here. Of those games, six (including Nava’s) involved any player hitting a grand slam (including three hit by the rookie in his first game – Nava, Kevin Kouzmanoff on September 2, 2006, and Jeremy Hermida on August 31, 2005). Incredibly, both of them hit grand slams in their first career at-bats, with Kouzmanoff in the lineup as the DH in the #8 slot and Hermida pinch-hitting in the #9 spot.
Also interesting is that Hector Luna played with both Kouzmanoff and Hermida when they hit their grand slams, and that in 2009, the Red Sox had no home runs with runners in scoring position by the #9 hitter. Quite a turnaround.
(I should point out that Bill Duggleby also hit a grand slam in his first career at-bat in 1898, but that the searchable data doesn’t go back that far.)
