Preview for Mets Game 140, September 10 September 10, 2015
Posted by tomflesher in Baseball, Sports.Tags: #imwith47, Braves, bullpen usage, gratuitous Hansel Robles, Mets
1 comment so far
Coming into tonight’s game against the Mets, the Braves are on a Meh streak: they took two from a terrible Phillies team over the past few nights, with scores of 7-2, 0-5, 8-1. Closer Arodys Vizcaino hasn’t pitched since the first game of that series; over those three games, the Braves bullpen threw 6 innings and gave up 3 runs, but all of those were in the 0-5 loss. The bullpen has thrown 422 1/3 innings this year and has a 4.67 ERA, but expect to see Vizcaino regardless as it’s been a few days since he worked.
Starter Shelby Miller has been hot and cold; he’s coming off a 4 1/3, 6-earned-run outing on September 5th, and he’s allowed 3 or more earned runs in three of his last four. However, when he’s good, he’s good: he has 2 complete games this year, both shutouts. Miller will probably be given a lot of rope tonight, which is fantastic for Lucas Duda and Daniel Murphy; Murphy is 3 for 7 lifetime against Miller with a double, and Duda is 3 for 8 with a double and a home run. David Wright is 3 for 6 against Miller, with Juan Uribe 1 for 7; Uribe’s OPS in Turner Field is an anemic .638, so expect to see Juan as a pinch hitter if you see him at all.
The Closer Monkey has Tyler Clippard on the vulture save watch because Jeurys Familia has pitched in the last three games, but Clippard has pitched in three of the last four and allowed runs in two of them; Clippard may come in for emergency firefighting, but with Clippard and Familia both fairly gassed (6 2/3 innings combined since September 6), I think it’s more likely we’ll see Hansel Robles handed the eighth and Addison Reed take the ninth. Again, that’s if we see them at all; Bartolo Colon hasn’t pitched back-to-back complete games since 2003, but the way the Mets have been hitting, Bart may get us seven or eight good innings and a strong lead. In that case we’d be more likely to see Bobby Parnell given an opportunity to win the fans back.
Visualizing 2-Out RBIs September 8, 2015
Posted by tomflesher in Baseball, Economics, Sports.Tags: 2-out RBIs, data visualization
add a comment
In yesterday’s win against the Nationals, Yoenis Cespedes hit a crucial RBI double to score David Wright. What’s more, this came with two outs. In every game against the Nationals, the Mets’ postseason is at stake, so even though Cespedes’ hit wasn’t a go-ahead run, the insurance was key.
The Mets haven’t had a great season with two outs; they have 182, 24th in the Majors. Of those 182, 25 were hit by Lucas Duda, who isn’t even active (he’s on the disabled list). That’s quite distinct from Kansas City, which has 51 of its 2-out RBIs credit to Kendrys Morales; Duda, the Mets’ leader in 2-out RBIs, isn’t even in the top 40. I thought it would be interesting to mine whether teams with a lot of 2-out RBIs won a lot of games, and whether there was any information gained if most of those runs being batted in by one player.

In the graph above, the number of 2-out RBIs this season is on the horizontal axis, and the number of wins this season is on the vertical axis. The size of each dot represents the number of RBIs owed to the team’s top scorer.
There’s a weak correlation between wins and 2-out RBIs – about .25. That makes sense, given that more runs lead to more wins (correlation .39 this year). There’s a weaker correlation (.16) between the number of RBIs with 2 outs from the leading scorer and wins; that’s probably due to the runs effect, to be honest.
Take a look at Kansas City in the upper right, with lots of 2-out RBIs and Kendrys Morales’ enormous dot. Then, take a look at St Louis in the upper left – Kolten Wong is there with a tiny 25-RBI dot. Similarly, Nolan Arenado and his 47 RBIs with 2 outs haven’t done much to pull Colorado up out of the southeast corner of the graph. Also interesting is the overlay of Pittsburgh (Starling Marte, 38) on Kansas City – it doesn’t get much clearer that the correlation here is small.
Carlos Torres is not a long reliever August 29, 2015
Posted by tomflesher in Baseball, Sports.Tags: Carlos Torres, ERA
add a comment
Carlos Torres has been a fixture in the Mets bullpen this year, tossing 52 1/3 innings thus far in relief. The Closer Monkey had him listed as our reliable setup man for a bit, but that spot has been taken over by the World’s Worst Sports Blog‘s current favorite bullpen man, Hansel Robles.
Torres cost the Mets last night’s game against the Red Sox, with a little bit of help from Blake Swihart. Torres has seemed unpredictable this year, sometimes seeming strong and other times unreliable. For that reason, I wanted to take a look at whether that’s recency bias or something else.
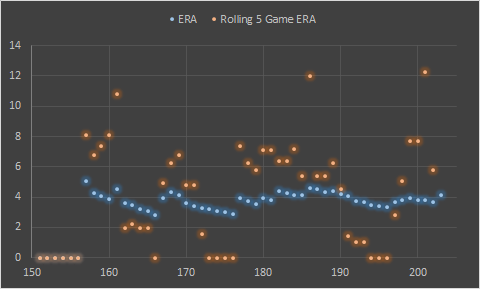
Carlos Torres’ ERA, season-long and on a rolling five-game basis
To do so, I generated a time series of Torres’ ERA for the season, which (predictably) spends most of its time decreasing, hovering around 4.0, and then periodically spikes upward to start another decrease. There are very few times when Torres’ season ERA increases more than one game at a time. In fact, he put up 39 scoreless appearances making up 39 2/3 innings of work this year. When he gives up runs, though, he gives up big ones.
The rolling-five-game ERA is meant to demonstrate that Torres’ performance is much spottier than we would expect – in many cases, his ERA5 spends several games at 0 before spiking up and staying high for several games. That indicates that Torres follows up runs with shorter appearances, more runs, or a combination of both, showing that he definitely has a streaky side.
In addition, the correlation between Torres’ runs allowed and his number of pitches is quite clear – it’s about .42. That indicates that Torres tires quickly. This is borne out by a back-of-the-envelope regression; estimating Carlos’ runs allowed as a function of his pitches that night and his days of rest, I found that each pitch thrown adds about .04 runs to Carlos’ total (significant above the 95% level). Days of rest doesn’t give a statistically significant estimate, nor do the quadratics of either term. (This looks pretty linear to me.) No combination of pitches thrown in the previous 3 games and batters faced in previous games give any additional information. This isn’t a great method – there’s obviously some endogeneity – but there is a strong correlation between Torres staying in the game longer and giving up more runs.
From the File Drawer – 6-run games are an indicator August 29, 2015
Posted by tomflesher in Baseball, Sports.Tags: file drawer
add a comment

Less noise for the season numbers, but the trends are unmistakable.4
At one point during the Mets’ tough loss to Boston last night, I shouted, “IT GETS THROUGH d’ARNAUD! IT GETS THROUGH d’ARNAUD!” The game started off pretty well, with Matt Harvey going six scoreless (including the aforementioned wild pitch to Travis d’Arnaud), but Logan Verrett had a rough seventh inning. Despite Tyler Clippard and Jeurys Familia doing what they do so well, Carlos Torres continued his slide. (He’ll be the topic of another post soon.)
One thing that surprised me was the number of runs the Mets allowed – six! The Mets have allowed 6 or more runs in 33 games, and six of them have been in August. In those six games, though, the Mets are 4-2. Does that sort of game really come out in the wash? I decided to crunch some numbers using the Baseball Reference Play Index and find out, with the hypothesis that the number of high-scoring games for opponents doesn’t really have an effect on the team’s overall record.
The chart attached to this post uses the number of games in which 6 or more runs are allowed on the x-axis and percentage on the y-axis. The blue datapoints are individual teams’ win-loss percentage in those 6-run games; the trend is pretty clear, although the outlier is the Toronto Blue Jays (who have played 48 such games and have a .417 winning percentage). The orange datapoints are season win-loss percentages, again as a function of 6-plus-run games. This trend is pretty clear, too: if you allow your opponents to score lots of runs, there’s a definite negative effect on your record, even though over a small sample size it might disappear. (Another perfectly good hypothesis busted by data!)
For the record, the correlation between 6-runs-allowed games and win percentage in those games is -.457, meaning that there’s a noticeable negative effect on performance in those games; however, the correlation between the number of those games and season win percentage is even stronger, at -.805. One way to interpret those numbers is to say that a team can recover in an individual high-scoring game, but a team that consistently allows such high scores will eventually see the losses add up.
A Pythagorean Exponent for the NHL March 17, 2015
Posted by tomflesher in Sports.Tags: hockey, luck, NHL, parameter identification, Pythagorean expectation, Sabres
4 comments
A Pythagorean expectation is a statistic used to measure how many wins a team should expect, based on how many points they score and how many they allow. The name ‘Pythagorean’ comes from the Pythagorean theorem, which measures the distance between the two short sides of a right triangle (the hypotenuse); the name reflects the fact that early baseball-centric versions assumed that Runs^2/(Runs^2 + Runs Allowed^2) should equal the winning percentage, borrowing the exponent of 2 from the familiar Pythagorean theorem (a^2 +b^2 =c^2).
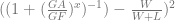
The optimal exponent turned out not to be 2 in just about any sport; in baseball, for example, the optimal exponent is around 1.82. This is found by setting up a function – in the case of the National Hockey League, that formula would be 

Porting that exponent into the current season, there are a few surprises. First of all, the Anaheim Ducks have been lucky – almost six full wins worth of luck. It would hardly be surprising for them to tank the last few games of the season. Similarly, the Washington Capitals are on the precipice of the playoff race, but they’re over four games below their expected wins. With 11 games to go, there’s a good chance they can overtake the New York Islanders (who are 3.4 wins above expectation), and they’re likely to at least maintain their wild card status.
On the other end, somehow, the Buffalo Sabres are obscenely lucky. The worst team in the NHL today is actually 4 games better than its expectation. Full luck standings as of the end of March 16th are behind the cut.
