Evaluating Hockey Analytics (and bonus luck numbers through November 15, 2015) November 16, 2015
Posted by tomflesher in Economics, Hockey, Sports.Tags: Corsi, Fenwick, Hockey analytics, NHL, Pythagorean expectation, Pythagorean luck, Sabres
add a comment
The Buffalo Sabres have been having a weird season. They’ve been outshot and won, they’ve outshot their opponents and lost, and (aside
from starting goalie Chad Johnson) their ice time leader, defenseman Rasmus Ristolainen, is bringing up the rear in relative Corsi and Fenwick stats. Ristolainen has a nasty -9.5 Corsi Rel, while fellow defenders Jake McCabe, Mark Pysyk, and Mike Weber have 8.5, 9.1, and 13.5, respectively. Ristolainen is averaging over 24 minutes a game, with the other three down by six to eight minutes each. What’s more, Ristolainen appears to be pulling his weight – he’s made 45 shots, second only to center Jack Eichel, and has 4 goals with an 8.9 shooting percentage. Ristolainen has 11 points (second only to Ryan O’Reilly with 14) but is tied with Tyler Ennis for the team’s worst +/- at -6. See? Weird year so far.
A lot of that is small sample size, of course. The Sabres are only 17 games into the 82-game season. They are, however, looking awfully lucky so far. Just how lucky? Let’s find out using the same Pythagorean metric that shows up in baseball.
Since Corsi and Fenwick both measure attempts to shoot, they’re noisier than goals. I was curious how much noisier, so I fired up R using the 2014 data and decided to update my post from earlier this year about the optimal Pythagorean exponent for the NHL. In it, I set up three minimization problems, all of them estimating winning percentage (and counting overtime losses as losses – the exponent changes only slightly if you estimate points-percentage instead of wins). Those three problems each minimized the sum of squares, using the Pythagorean formulas. The first used the traditional method of estimating goals and goals against; the second used Corsi For and Corsi Against; the third used Fenwick For and Fenwick Against.
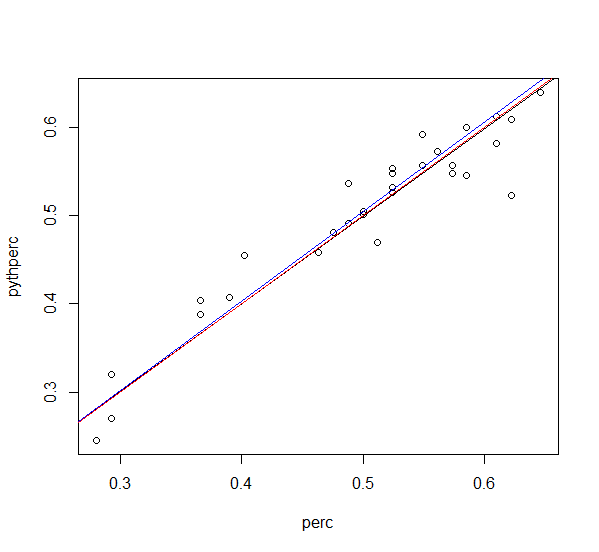
Pythagorean 2.11 in black, Corsi 1.445 in blue, and Fenwick 1.88 in red.
The Goals For/Goals Against form (

The Corsi For/Corsi Against form returns an optimal x of 1.445, but the residual sum of squares ballooned to .24. That means on average the squared error is almost ten times as great – you get a pretty good predictor, but with much more “noise.”
Right in the middle, the Fenwick form yields an optimal x of 1.877, with a residual squared error of .203. It’s a better predictor of wins and losses than the Corsi version, but it’s still not as good a predictor of wins as the simple Goals For/Goals Against form.
Above, I’ve graphed each team’s winning percentage against the Pythagorean (Goals For/Goals Against form), as well as all three trendlines: note that the black Goals line and the red Fenwick line are extremely close, while the blue Corsi line is a bit higher up. Two conclusions can be drawn:
- The Fenwick line is a better predictor than the Corsi line, but the Corsi line appears to bias expected percentage upward. That is, it overestimates the imact of each shot more than goals and Fenwick do.
- Since the Fenwick line is a better predictor, that indicates that Corsi’s inclusion of blocked shots probably does just add noise. Blocked shots are, at least according to this model, of limited predictive value.
Through November 15, Corsi For % had a correlation of .11 with points and .125 with winning percentage; Fenwick For % had correlations of .17 and .19, respectively. Blocked shots had negative correlations in both cases.
Pythagorean luck is defined as the number of wins above expectation. Behind the jump are the numbers, through November 15, demonstrating which teams are lucky and which aren’t.
What is the Corsi statistic? (And why is there a Fenwick number?) November 16, 2015
Posted by tomflesher in Hockey, Sports.Tags: Corsi, corsi statistic, evergreen, Fenwick, fenwick number, Hockey analytics, NHL
2 comments
Growing up in Buffalo, I was surrounded by hockey, whether it was watching the Sabres or heading to the rink to watch my brother play defense as a bantam or high schooler. During those years, my father, who could barely skate, often served as a volunteer coach for my brother’s teams. Like Malcolm Gladwell’s story of Vivek Ranadivé leading his “little blonde girls” to success using out-of-the-box basketball coaching, my father felt he was bringing an outsider’s perspective to the game by emphasizing a simple philosophy: own the puck.
This is easier said than done, of course, and when a group of squirts, peewees, or bantams head out onto the ice they need to apply some serious skill in order to “own the puck.” Overall, though, the point of owning that puck is to put it into the net. So, logically, the more a team controls the puck, the more likely it is to control the game.
It’s possible, of course, for a team to take many more shots and still lose, but the Corsi stat is meant to measure overall control. As such, it includes all attempted shots, so Corsi, as such, is defined as Shots + Attempted Shots – Shots Against – Attempted Shots Against. This gives you a simple differential in shots.
You’ll also see the following stats:
- Corsi For: Shots + Attempted Shots by the team, making it possible to isolate whether a team is making too few shots or allowing too many
- Corsi Against: Shots + Attempted Shots by the opposing team
- Corsi For Percentage (CF%): 100*Corsi For/(Corsi For + Corsi Against), giving a ratio rather than a simple differential. This measures what percentage of shots and shot attempts a team makes compared to its opponents. A CF% above 50% means a team attempts more shots than its opponent.
- Corsi On: A team’s Corsi while a particular player is on the ice scaled up to 60 minutes of ice time, effectively measuring whether the player’s Corsi is as good as, better than, or worse than the team’s as a whole. A Corsi ON greater than the team’s means the player contributes proportionally more to the team than ice time would indicate.
- Corsi Relative (Corsi REL): Corsi On – Corsi Off, showing whether a team performs better or worse with a player on the ice. If Corsi REL is positive, the team does a better job with the player on the ice.
Corsi was named after a Buffalo Sabres goaltending coach. Bob McKenzie of TSN shared the story of the Corsi number in 2014. Financial analyst Tim Barnes, writing under the pseudonym Vic Ferrari, heard Sabres GM Darcy Regier discussing shot attempts and save percentage as a goalie metric, but Ferrari didn’t care for the name “Regier Number” or “Ruff Number” (for Sabres coach Lindy Ruff). After browsing photos of the Sabres staff, Ferrari settled on Jim Corsi (above) as the eponym for the statistic. Interestingly, Corsi actually did come up with the idea and planted it in Regier’s head.
A similar stat, the Fenwick, simply discounts blocked shots since blocking shots is a skill.
