NHL Luck and Playoffs through February 1 February 1, 2016
Posted by tomflesher in Hockey, Sports.Tags: Hockey analytics, NHL, Pythagorean luck
add a comment
Following the technically brilliant performance of John Scott in last night’s All-Star Game,1 the NHL is slightly past its midway point in the season. Most teams have played 49 of their 82 games, and while the Buffalo Sabres haven’t been mathematically eliminated yet, winning every game for the remainder of the season would only get them as many points as last year’s third-place finisher in the Eastern conference.
In other words, it’s spring.
Currently, the Eastern Conference would send Florida, Tampa Bay, and Detroit automatically to the playoffs from the Atlantic division, along with Washington and both New York teams. The wild cards would be Boston and New Jersey, with the latter at 52 points. The Sabres have 44.
The Western Conference would send Chicago, Dallas, and St. Louis from the Central and Los Angeles, San Jose, and Arizona automatically from the Pacific. Both wild card slots would come from the Central, going to Nashville with 56 and Colorado with 57. Minnesota (55) would be edged out, though they’d have made the playoffs instead of Arizona under last year’s system.
That’s a pisser for the Wild, who are actually playing about 3.3 wins below expectation; in other words, for their goals for and goals against, we’d expect about 26.3 wins, but they only have 23. Arizona, meanwhile, is at 24 wins, but “should” have only about 21.7. Though Minnesota can overtake Nashville or Colorado relatively easily, it looks like the more competitive Central division is going to lead to someone being excluded from the playoffs who would have made it under last year’s system.
Luck numbers through the All-Star Break follow.
| Team | pythwins | luck | GP | W | L | PTS |
| Arizona Coyotes | 21.7 | 2.3 | 49 | 24 | 20 | 53 |
| Los Angeles Kings | 28.0 | 2.0 | 49 | 30 | 16 | 63 |
| Washington Capitals | 33.2 | 1.8 | 47 | 35 | 8 | 74 |
| St. Louis Blues | 26.2 | 1.8 | 52 | 28 | 16 | 64 |
| Chicago Blackhawks | 31.5 | 1.5 | 53 | 33 | 16 | 70 |
| Colorado Avalanche | 26.0 | 1.0 | 52 | 27 | 22 | 57 |
| Ottawa Senators | 22.1 | 0.9 | 50 | 23 | 21 | 52 |
| Philadelphia Flyers | 20.1 | 0.9 | 47 | 21 | 18 | 50 |
| Anaheim Ducks | 21.1 | 0.9 | 47 | 22 | 18 | 51 |
| Dallas Stars | 30.2 | 0.8 | 50 | 31 | 14 | 67 |
| Calgary Flames | 20.4 | 0.6 | 48 | 21 | 24 | 45 |
| Detroit Red Wings | 24.5 | 0.5 | 49 | 25 | 16 | 58 |
| New Jersey Devils | 24.5 | 0.5 | 50 | 25 | 20 | 55 |
| New York Rangers | 27.0 | 0.0 | 49 | 27 | 17 | 59 |
| Edmonton Oilers | 19.1 | -0.1 | 50 | 19 | 26 | 43 |
| Winnipeg Jets | 22.2 | -0.2 | 49 | 22 | 24 | 47 |
| Carolina Hurricanes | 23.2 | -0.2 | 51 | 23 | 20 | 54 |
| San Jose Sharks | 26.3 | -0.3 | 48 | 26 | 18 | 56 |
| Nashville Predators | 24.4 | -0.4 | 50 | 24 | 18 | 56 |
| Florida Panthers | 29.5 | -0.5 | 49 | 29 | 15 | 63 |
| Tampa Bay Lightning | 27.5 | -0.5 | 49 | 27 | 18 | 58 |
| Pittsburgh Penguins | 24.6 | -0.6 | 48 | 24 | 17 | 55 |
| Buffalo Sabres | 20.7 | -0.7 | 50 | 20 | 26 | 44 |
| New York Islanders | 26.0 | -1.0 | 47 | 25 | 16 | 56 |
| Montreal Canadiens | 25.0 | -1.0 | 50 | 24 | 22 | 52 |
| Vancouver Canucks | 21.1 | -1.1 | 50 | 20 | 19 | 51 |
| Boston Bruins | 27.1 | -1.1 | 49 | 26 | 18 | 57 |
| Toronto Maple Leafs | 20.0 | -3.0 | 48 | 17 | 22 | 43 |
| Minnesota Wild | 26.3 | -3.3 | 49 | 23 | 17 | 55 |
===
1Since I will never be able to type that phrase again, I figured I’d use it while I could.
Evaluating Hockey Analytics (and bonus luck numbers through November 15, 2015) November 16, 2015
Posted by tomflesher in Economics, Hockey, Sports.Tags: Corsi, Fenwick, Hockey analytics, NHL, Pythagorean expectation, Pythagorean luck, Sabres
add a comment
The Buffalo Sabres have been having a weird season. They’ve been outshot and won, they’ve outshot their opponents and lost, and (aside
from starting goalie Chad Johnson) their ice time leader, defenseman Rasmus Ristolainen, is bringing up the rear in relative Corsi and Fenwick stats. Ristolainen has a nasty -9.5 Corsi Rel, while fellow defenders Jake McCabe, Mark Pysyk, and Mike Weber have 8.5, 9.1, and 13.5, respectively. Ristolainen is averaging over 24 minutes a game, with the other three down by six to eight minutes each. What’s more, Ristolainen appears to be pulling his weight – he’s made 45 shots, second only to center Jack Eichel, and has 4 goals with an 8.9 shooting percentage. Ristolainen has 11 points (second only to Ryan O’Reilly with 14) but is tied with Tyler Ennis for the team’s worst +/- at -6. See? Weird year so far.
A lot of that is small sample size, of course. The Sabres are only 17 games into the 82-game season. They are, however, looking awfully lucky so far. Just how lucky? Let’s find out using the same Pythagorean metric that shows up in baseball.
Since Corsi and Fenwick both measure attempts to shoot, they’re noisier than goals. I was curious how much noisier, so I fired up R using the 2014 data and decided to update my post from earlier this year about the optimal Pythagorean exponent for the NHL. In it, I set up three minimization problems, all of them estimating winning percentage (and counting overtime losses as losses – the exponent changes only slightly if you estimate points-percentage instead of wins). Those three problems each minimized the sum of squares, using the Pythagorean formulas. The first used the traditional method of estimating goals and goals against; the second used Corsi For and Corsi Against; the third used Fenwick For and Fenwick Against.
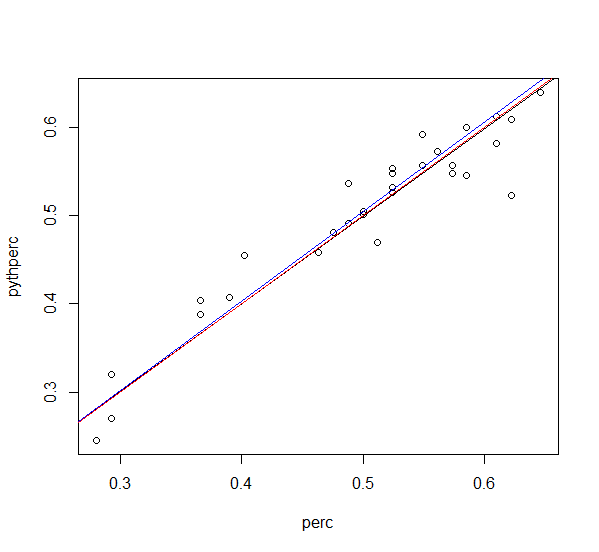
Pythagorean 2.11 in black, Corsi 1.445 in blue, and Fenwick 1.88 in red.
The Goals For/Goals Against form (

The Corsi For/Corsi Against form returns an optimal x of 1.445, but the residual sum of squares ballooned to .24. That means on average the squared error is almost ten times as great – you get a pretty good predictor, but with much more “noise.”
Right in the middle, the Fenwick form yields an optimal x of 1.877, with a residual squared error of .203. It’s a better predictor of wins and losses than the Corsi version, but it’s still not as good a predictor of wins as the simple Goals For/Goals Against form.
Above, I’ve graphed each team’s winning percentage against the Pythagorean (Goals For/Goals Against form), as well as all three trendlines: note that the black Goals line and the red Fenwick line are extremely close, while the blue Corsi line is a bit higher up. Two conclusions can be drawn:
- The Fenwick line is a better predictor than the Corsi line, but the Corsi line appears to bias expected percentage upward. That is, it overestimates the imact of each shot more than goals and Fenwick do.
- Since the Fenwick line is a better predictor, that indicates that Corsi’s inclusion of blocked shots probably does just add noise. Blocked shots are, at least according to this model, of limited predictive value.
Through November 15, Corsi For % had a correlation of .11 with points and .125 with winning percentage; Fenwick For % had correlations of .17 and .19, respectively. Blocked shots had negative correlations in both cases.
Pythagorean luck is defined as the number of wins above expectation. Behind the jump are the numbers, through November 15, demonstrating which teams are lucky and which aren’t.
Exactly how big an impact have those trades had? August 26, 2015
Posted by tomflesher in Baseball.Tags: bullpen, Pythagorean luck, trades, wins above expectation
add a comment
The Mets made some huge deals near the trade deadline to pick up Juan Uribe and Kelly Johnson on July 25, Tyler Clippard on July 28, and Yoenis Cespedes on August 1. (Those are the dates of the first games the players appeared in for the Mets.) Let’s take a look at the effects of those trades. If there was no effect from the trades, then the Mets’ improvement would have to be basically indistinguishable from chance.

Juan Uribe on July 25; credit slgckgc on Flickr
- April: The Mets scored 97 runs and and allowed 81 for a 16-run differential and a .581 Pythagorean expectation. They went 15-8 for a win percentage of .652, giving them a Pythagorean differential of .071 and 1.63 Wins Above Expectation.1
- May: 95 runs scored, 105 allowed, 11-14, for an expected .455 winning percentage, .440 actual winning percentage, -.015 differential and -.36 WAE.
- June: 84 runs scored, 105 allowed, 9-15, for an expected .413, actual .375, -.038 differential and -.90 WAE.
- July: 89 runs scored, 83 allowed, 11-12, for an expected .532, realized .478, -.053 differential and -1.23 WAE.
- August: 137 runs scored, 84 allowed, 16-5, for an expected .709, actual .762, .053 differential and 1.11 WAE.
Clearly, the jump in August has been enormous, especially since they only played 21 games in August; in fact, the Mets averaged 3.76 runs per game through July, but 8.2 in August. In fact, if we start on July 25, the Mets have averaged 9.26 runs per game. Between Uribe, Johnson, and Cespedes, that’s a huge improvement – five and a half runs per game!
What about Clippard? Well, for one, the Mets averaged 3.9 runs allowed through July; since August 1, we’re at 4.0. However, Clippy’s ERA with the Mets is 1.93, and the bullpen ERA overall is 3.08. The August ERA for the bullpen has been an alarming 3.59, but that includes the hilarious trip to Colorado, too. That makes Tyler’s low ERA even more impressive. (For the record, future Mets closer Hansel Robles has a 3.27 August ERA – that’s 4 ER in 11.0 IP – and current closer Jeurys Familia hasn’t allowed a run in 11 1/3 innings pitched in August.) Clippy’s definitely value-added in the bullpen, especially considering that the alternative might be Dario Alvarez or Dillon Gee unhappy in his role.
Most notably, though, since the Mets picked up Uribe and Johnson, their wins above expectation have been statistically zero. They’ve been playing to their potential, not above it, since July 25.
We’re in for an interesting end to the year.
—
1 Pythagorean differential is computed as (Winning percentage – Pythagorean Expectation). Wins Above Expectation is computed as Pythagorean differential times games played. They measure the same concept but are scaled differently.
