Spitballing: Jim Thome and Recognition July 21, 2011
Posted by tomflesher in Baseball.Tags: 600 home runs, Alex Rodriguez, Derek Jeter, Gary Sheffield, Jim Thome, Spitballing
add a comment
It’s no secret that I’m a fan of Jim Thome. Although he never played in my hometown, Buffalo was Cleveland’s AAA affiliate when I was a wee lad and so I’ve always had a soft spot in my heart for Indians. I also admire Thome’s small-town, farm-boy image. The PepsiMAX Clubhouse in the Corn ad showing Jim asking for autographs played off that image.
Thome’s pretty popular on the internet, based on the proportion of traffic I’m getting from searches for his name. Kyle Kendrick (no, not that one) of the Winfield (Kansas) Daily Courier noticed, though, that media has been much quieter about Thome’s achievement than about Alex Rodriguez‘ same run last year. Kendrick blames the lack of coverage on Thome’s image:
Honestly, I believe it’s because he is too quiet and too humble for his own good. He isn’t flashy like Bonds, or flamboyant like Sosa or making it look easy like Griffey did. Therefore people, including the media, haven’t latched on to him like they have done with other hitters in the past. Add that to the fact that he’s never played more than one season in a very big media market town like New York or Boston or Chicago, and you may come to understand why he isn’t getting the bigtime coverage.
(Let’s leave aside the dismissal of three seasons in Philadelphia and three and a half in Chicago for a moment.)
It’s pretty clear to me why Derek Jeter‘s 3000-hit milestone got more coverage than Thome’s: Jeter is, for better or for worse, much more well-known than Thome. The average fan probably knows Jeter’s face, but it would take a much more interested fan to recognize Thome’s face. Jim was last an All-Star in 2006 and spent five and a half of the last six seasons in the AL Central, meaning that the largest markets that he was regularly exposed to were Detroit and Chicago. (Granted, he spent half a season with the Dodgers.) He’s not well-known enough to be wildly popular, and he’s not hated enough (like Rodriguez) for people to take pleasure in any failure that might happen. As soon as A-Rod’s production slowed down, people started accusing him of choking. Thome’s been like clockwork throughout his career, but even if he did slow down, it’s no fun to call a likeable guy a choker. Gary Sheffield was a Met at the time he hit his 500th, so there was a bump in coverage from being with a large-market team, but he got a lot of coverage too. Is it any coincidence he was widely regarded as a bit of a tool?
As I said earlier, Thome will likely hit his 600th home run in August, and it’ll probably be only a few weeks before the September callups. Minnesota is five games back, but in third place in the AL Central, and 12 games back from the wild card. Thome probably won’t get his glory this postseason. Hopefully he’ll get his recognition when he hits #600, but whether or not he does, he’ll go down in history as the eighth member of an exclusive club that won’t expand for some time longer.
A fifteen-inning offensive drought July 18, 2011
Posted by tomflesher in Baseball.Tags: Jacoby Ellsbury, Rays, Red Sox, weird lines
2 comments
Last night’s ESPN game, between the Red Sox and the Rays, was a pitchers’ duel of the highest magnitude. John at Baseball Reference already looked for other games where both starters had game scores of 85 or higher, and neither team had to call on a position player to pitch, but I thought one of the most interesting things to happen was offensive in nature.
Neither team scored until the sixteenth inning, at which point Dustin Pedroia followed up a John Reddick walk, a Jason Varitek sacrifice, and a Marco Scutaro infield single (to move Reddick to third) with a single to right field. Every batter up to that point was productive and helped manufacture that run… except Jacoby Ellsbury, who flied out to left between Scutaro and Pedroia. In fact, every lineup spot had either a hit, a walk, or a productive out except for Ellsbury, who led off. (Granted, Varitek’s only productivity was his sacrifice, but that’s enough.) Ellsbury had 8 plate appearances, all of them at-bats, and didn’t reach base at all.
Even getting 8 plate appearances is rare. Since 2002 (and through July 7), only 403 batters have had 8 plate appearances, including a handful with 10 and quite a few with 9. All five of the 10-plate-appearance games took place on April 17, but some of them took place in 2008 and some in 2010. (Just an odd coincidence.) Of those 403, only 12 failed to reach base at all. Corey Patterson and Trot Nixon share the record for most plate appearances without reaching base, with 10.
Ellsbury’s streak of 8 plate appearances without reaching base is especially weird because he’s so talented. Ellsbury has a .370 OBP, meaning that on average he reaches base 37% of the time (or, he only gets sent back to the dugout 63% of the time). If we assume last night’s plate appearances were random draws, the probability of 8 times without reaching base would be

or, in English, vanishingly rare.
Mets Fans, Meet Your New Closer July 17, 2011
Posted by tomflesher in Baseball, Economics.Tags: Bobby Parnell, closers, Francisco Rodriguez, Jason Isringhausen, Mets, Pedro Beato
add a comment
It’s been a while since the Mets traded Francisco Rodriguez, the 1982 model, to the Milwaukee Brewers. Mets manager Terry Collins has indicated that Rule 5 draft pick Pedro Beato, cranky old man Jason Isringhausen, and veteran Met Bobby Parnell are in competition for the closer role. Rodriguez had a reputation for being unpredictable, and watching him certainly gave that impression – he pitched wildly and emotionally.
I decided to dig out K-Rod’s stats for this year and figure out what his numbers looked like, using a couple of measures of control: his K/BB ratio (aka ‘control ratio’), his K/9 and BB/9, and then his batters faced per out (BFPO). If Rodriguez is unpredictable, then he should have a relatively high standard deviation for BFPO. With that in mind, if predictability is an important factor in selecting a closer, these stats are relevant for Beato, Isringhausen, and Parnell as well. Here they are, for 2011:
The best number overall is bolded. The best from among the three closer candidates is italicized.

Rodriguez had the best KBB and BB9, as well as the lowest standard deviation, but his BFPO was the highest in the group. Since he wasn’t walking many batters, that indicates that he was giving up a lot of hits or otherwise allowing lots of runners. That’s not good – it breeds high-pressure situations, some of which are bound to result in runs.
Beato had the lowest BFPO, but Parnell led all the other categories for current Mets as well as having a better K/9 than Rodriguez as well. Parnell’s BFPO was only .02 below Frankie’s, and was .15 higher than Beato’s (and about .05 greater than Izzy’s). Without a lot more data, it’s hard to compare these numbers meaningfully. However, over the course of 70 innings, that .15 differential adds up to 31.5 extra baserunners for Parnell above Beato. Parnell’s lower standard deviation means that those runners are going to be spread a bit more evenly than Beato’s, but it’s tough to distinguish the best choice. Isringhausen has been strong as a setup man, and Beato, as a rookie, is still unpredictable.
Parnell will probably come out of this with the closer’s job, but Collins would be a fool not to leave Isringhausen where he is.
Jim Thome, Revised July 14, 2011
Posted by tomflesher in Baseball.Tags: 600 home runs, Baseball, forecasting, Jim Thome
add a comment
In an earlier post, I predicted that if Jim Thome stayed healthy, he’d hit the 600 home run mark at some point in late July, with a loose prediction that he’d hit it around July 26 (the Twins’ 100th game). Since he got hurt, and since he’s been playing hurt for a while, it’s worth refiguring the date.
Thome needs five home runs.
This year, Thome has hit 6 home runs in 128 plate appearances for a rate of .046875 home runs per plate appearance, or one home run every 21 1/3 plate appearances. That’s down quite a bit from his career rate, which worked out to one home run every 13.5 plate appearances. Since his return, though, he’s hit 2 home runs in 34 plate appearances, or one every 17. If that represents his true production, then he’ll need about 5*17 = 85 plate appearances to hit five more home runs.
Since his return, Thome has averaged 2.8 plate appearances per game he played in, but he’s had two nights off. Per team game, that works out to 2.4 plate appearances. That means, roughly, he’ll need about 85/2.4 = 35.4 team games to hit those 5 home runs, or, to round it up, he’ll probably hit his 600th 35 games from now. That 35th game is team game #124, at home against the Yankees on August 18th. If he maintains his 2.4 plate appearances per team game and he produces at his career rate (every 13.5 plate appearances), he’ll need about 68 plate appearances, or 28 games and change. The 29th game is on Friday, August 12, in Cleveland. (Wouldn’t that be sweet for Thome?) If he continues hitting ever 21 1/3 plate appearances, that means he’ll need about 107 plate appearances, or about 44 games and change. The 45th game is August 27, at home against Detroit.
It’ll become easier to nail down, but there’s about a ten-day window where I’d lay my odds for Thome to hit #600. If I had to narrow it down to a week, I’d shoot for the six-game series that starts on the road at Detroit on August 15 and ends at home against the Yankees on August 21. That accounts for Thome’s depressed home run production but doesn’t penalize him for playing hurt the way that assuming his pre-injury rate would.
Quickie: Halladay’s All-Star No-Hit Bid July 13, 2011
Posted by tomflesher in Baseball.add a comment
The All-Star Game is managed strangely. That’s a given. It’s the only place where Roy Halladay could start a game by retiring six consecutive batters and then be relieved by Cliff Lee. It’s the only place where you get a single inning pitched by Jered Weaver, no hits (one walk), and immediate relief in the second from David Robertson. (Robertson faced the minimum, but allowed a hit to Lance Berkman. Berk was then caught attempting to steal second.) Lee also pitched a no-hit inning before running into trouble in the third, requiring a call to the bullpen for the eventual winning pitcher, Tyler Clippard.
There has never been an All-Star Game where both starting pitchers were lifted with no hits. Since 1994, the norm has been to allow the starter to pitch no more than two innings. (Greg Maddux in 1994, Dwight Gooden in 1988, and Brett Saberhagen in 1987 each pitched three, but they’re the only ones since 1986 when Gooden and Roger Clemens each went three.) Even if we grant that Weaver only pitched one inning, the past three All-Star Games didn’t even feature no-hit first innings:
- 2010: David Price pitched a perfect top of the first, but Ubaldo Jimenez gave up a one-out walk and single.
- 2009: Tim Lincecum gave up a leadoff single to Ichiro Suzuki despite Halladay’s perfect bottom of the first.
- 2008: Lee pitched a perfect top of the first, but Ben Sheets gave up a one-out single to Derek Jeter.
Halladay’s batting average against this year has been .240, and his OBP against is .264. That means the probability of two perfect innings is

or odds of about 5.29 against.
Since the management of the All-Star Game is focused mostly on getting as many players in the game as possible, you can’t really fault Bruce Bochy for lifting Halladay. I have to say, though, I was pretty disappointed when Lee came out in relief to start the third.
A list of the thirteen All-Star Game pitchers prior to Halladay to be lifted after a no-hit start is here.
Home Field Advantage Again July 12, 2011
Posted by tomflesher in Baseball, Economics.Tags: attendance effects, Baseball, Giants, home field advantage, linear regression, probability, probit, statistics
add a comment
In an earlier post, I discussed the San Francisco Giants’ vaunted home field advantage and came to the conclusion that, while a home field advantage exists, it’s not related to the Giants scoring more runs at home than on the road. That was done with about 90 games’ worth of data. In order to come up with a more robust measure of home field advantage, I grabbed game-by-game data for the national league from the first half of the 2011 season and crunched some numbers.
I have two questions:
- Is there a statistically significant increase in winning probability while playing at home?
- Is that effect statistically distinct from any effect due to attendance?
- If it exists, does that effect differ from team to team? (I’ll attack this in a future post.)
Methodology: Using data with, among other things, per-game run totals, win-loss data, and attendance, I’ll run three regressions. The first will be a linear probability model of the form

where 

As such, I’ll also run a Probit model of the same equation to avoid problems caused by the simplicity of the linear probability model.
Finally, just as a sanity check, I’ll run the same regression, but for runs, instead of win probability. Since runs aren’t binary, I’ll use ordinary least squares, and also control for the possibility that games played in American League parks lead to higher run totals by controlling for the designated hitter:

Since runs are a factor in winning, I have the same expectations about the signs of the beta values as above.
Results:
Regression 1 (Linear Probability Model):

So, my prediction about the attendance betas was incorrect, but only because I failed to account for the squared terms. The effect from home attendance increases as we approach full attendance; the effect from road attendance decreases at about the same rate. There’s still a net positive effect.
Regression 2 (Probit Model):

Note that in both cases, there’s a statistically significant 
Finally, the regression on runs:
Regression 3 (Predicted Runs):
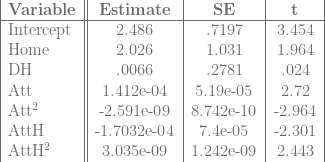
Again, with runs, there is a statistically significant effect from being at home, and a variety of possible attendance effects. For low attendance values, the Home effect is probably swamped by the negative attendance effect, but for high attendance games, the Home effect probably outweighs the attendance effect or the attendance effect becomes positive.
Again, the Home effect is statistically significant no matter which model we use, so at least in the National League, there is a noticeable home field advantage.
Padre Differential July 11, 2011
Posted by tomflesher in Baseball, Economics.Tags: Baseball, baseball-reference.com, linear regression, National League, Padre Differential, Padres, Phillies, runs allowed, runs scored, statistics
1 comment so far
I was all set to fire up the Choke Index again this year. Unfortunately, Derek Jeter foiled my plan by making his 3000th hit right on time, so I can’t get any mileage out of that. Perhaps Jim Thome will start choking around #600 – but, frankly, I hope not. Since Jeter had such a callous disregard for the World’s Worst Sports Blog’s material, I’m forced to make up a new statistic.
This actually plays into an earlier post I made, which was about home field advantage for the Giants. It started off as a very simple regression for National League teams to see if the Giants’ pattern – a negative effect on runs scored at home, no real effect from the DH – held across the league. Those results are interesting and hold with the pattern that we’ll see below – I’ll probably slice them into a later entry.
The first thing I wanted to do, though, was find team effects on runs scored. Basically, I want to know how many runs an average team of Greys will score, how many more runs they’ll score at home, how many more runs they’ll score on the road if they have a DH, and then how many more runs the Phillies, the Mets, or any other team will score above their total. I’m doing this by converting Baseball Reference’s schedules and results for each team through their last game on July 10 to a data file, adding dummy variables for each team, and then running a linear regression of runs scored by each team against dummy variables for playing at home, playing with a DH, and the team dummies. In equation form,

For technical reasons, I needed to leave a team out, and so I chose the team that had the most negative coefficient: the Padres. Basically, then, the 

That is, the Padre Differential shows whether a team’s per-game run differential is higher or lower than the Padres’.
The table below shows each team in the National League, sorted by Padre Differential. By definition, San Diego’s Padre Differential is zero. ‘Sig95’ represents whether or not the value is statistically significant at the 95% level.

Unsurprisingly, the Phillies – the best team in baseball – have the highest Padre Differential in the league, with over 1.3 runs on average better than the Padres. Houston, in the cellar of the NL Central, is the worst team in the league and is .8 runs worse than the Padres per game. Florida and Chicago are both worse than the Padres and are both close to (Florida, 43) or below (Chicago, 37) the Padres’ 40-win total.
Don Kelly Wears The Crown Once Again July 9, 2011
Posted by tomflesher in Baseball.Tags: Brandon Inge, catching, Don Kelly, Super utility dervish, utility player
add a comment
As reigning Utility King, I didn’t think Don Kelly could do much more to impress me. It seems I was wrong. 
I’m not sure how I missed it, but about a week ago, Kelly made a fool of me for saying that he had played every position except catcher. I can’t say it much better than Samara Pearlstein did at Roar of the Tigers, though:
There was only one option left, and that option was the infinitely versatile Don Kelly. This season alone he has played every outfield position, first base, third base, DH, and pitcher– and now catcher. In previous seasons he has seen (brief) time at second base and shortstop as well.
(The photo is courtesy Samara’s ridiculously generous sharing policy. Thanks!)
… so is Brandon Inge angry about Don Kelly taking his emergency catcher job? For whatever reason, Jim Leyland ruled that out in the spring, so it looks like Kelly has taken over as the Tigers’ top utilityman.
Kelly last played shortstop for the Pirates in 2007 and second base for the Tigers in 2009. In addition to playing both sides of the battery, he’s played first, third, left, center, right, and designated hitter, and he’s been used as a pinch hitter and a pinch runner this year.
Home Field Advantage July 9, 2011
Posted by tomflesher in Baseball, Economics.Tags: Giants, home field advantage, linear regression
1 comment so far
The Mets unfortunately played a 10 PM game in San Francisco last night, so I’m short on sleep today. I do remember, though, that Gary Cohen mentioned, repeatedly, the Giants’ significant home field advantage. Even after last night’s loss at the hands of Carlos Beltran (coming from a rare blown save by Brian Wilson), the Giants have a .619 winning percentage at home (26-16) versus a .500 winning percentage on the road (24-24). Interestingly, their run differential is much worse at home – they’ve scored 205 and allowed 184 on the road for a total differential of +21, but their run differential at home is actually negative. They’ve scored 120 but allowed 135 for a differential of -15.
Some of that is due to the way walk-offs are scored – they end an inning immediately, so a scoring inning at home is cut short when the same inning on the road would continue and might lead to further scoring – but it’s still quite shocking to see that large a split. So far, the Giants have only scored 11 walk-off RBIs, compared with only 7 RBIs in the 9th inning on the road that came with the Giants ahead. So, even adding in an extra few runs wouldn’t account for the difference.
Last year, there wasn’t much of a home field effect at all. Running a very simple linear regression of runs scored against dummy variables for playing at home and playing with a DH, I estimated that

and only the intercept term, which represents (essentially) the unconditional average number of runs the Giants score, was significant.
For this year, the numbers are quite different.

with both the intercept and Home terms significant at the 95% level. It’s clear that the Giants are winning more at home, but it’s not because they’re scoring more at home.
