Sabres Game 19 Recap: Penalties are costly November 20, 2015
Posted by tomflesher in Economics, Hockey, Sports.Tags: Blues, Linus Ullmark, PDO, power play, Sabres
add a comment
Despite a solid performance by rookie goaltender Linus Ullmark, the Sabres dropped a shootout loss to the St. Louis Blues last night. Going into the shootout, the teams had played 65 minutes of 2-2 hockey. Sam Reinhart and Ryan O’Reilly scored at even strength for the Sabres; both Blues goals, by Kevin Shattenkirk and Vladimir Tarasenko, came on the power play. Those power plays were costly; Tyler Ennis was penalized 5 minutes for boarding at 5:00 into the first, and Shattenkirk’s goal followed 34 seconds later. In the third period, Jake McCabe was called for hooking 3:24 in, and Tarasenko’s goal came at 4:26. Alex Steen scored the only shootout goal for Saint Louis; O’Reilly, Ennis, and Evander Kane shot and missed for Buffalo. Meanwhile, the Blues’ penalties came in bunches, and the Sabres were woefully unable to take advantage of brief 2-man-advantage conditions in periods 2 and 3.
The Sabres aren’t a bad team on the power play – against a league average of 19.21% of power plays converted, the Sabres convert 22.58% of opportunities into goals. They’re much, much worse defensively, though: the league average penalty kill percentage is 80.79%1, but the Sabres kill only 72.92% of penalties. Buffalo has a miserable 96 power play PDO, which is an awful name for a great stat. In general, save% plus shooting% should average out to about 100, or so goes the theory; teams with lower scores are unluckier, and teams with higher scores are luckier. 96 in power play situations puts then 27th in the league. While shorthanded, they have an abysmal 92.3 PDO, 23rd in the league.
Some of that is mitigated by the Sabres’ low (thus far) penalty numbers – the average team has allowed 62 power play opportunities and the Sabres have allowed only 48 – but the Sabres have allowed 13 goals in those 48 opportunities while the league average is 12 goals on 62 opportunities. Just imagine if the Sabres were chippier and allowed more power plays.
The Sabres have fixed some of their early-season issues with shots, outshooting the Blues 34-29, and Ullmark (minion mask and all) managed to lower his goals against average to 2.31. He’s been remarkably consistent. He can’t, though, carry the team on his back. As a developing rookie, he needs his skaters to take advantage of those 2-man advantage situations. The Sabres had 2:35 of two-man advantage and couldn’t convert. A single goal would have put a second point on the board for the Sabres and another win in Ullmark’s record.
—
1 Obviously, the league average PP% and PK% have to add up to 100%.
Buffalo Sabres Game 18 Recap: Ullmark, Moulson, and Ristolainen November 18, 2015
Posted by tomflesher in Economics, Hockey, Sports.Tags: hockey, Recap, Sabres, Stars
add a comment
The Sabres dropped a game to Western Conference leaders the Dallas Stars on November 17th. Going into the final minutes, the Sabres were down 2-1, but after pulling goaltender Linus Ullmark they allowed an empty-net goal at 18:33. Dallas’ Alex Goligoski had two points for the Stars. Jack Eichel, Tyler Ennis, and Ryan O’Reilly each had four shots for the Sabres, with O’Reilly scoring the only goal for Buffalo.

Matt Moulson in 2013. Photo: Robert Kowal
Winger Matt Moulson led the team in Corsi REL% last night with 25.4. That is, 25.4% more shots are made by the Sabres than by their opponents in a hypothetical game in which Moulson plays all 60 minutes than in a hypothetical Moulson-free game. Moulson played 17:39 last night and took no shots himself, but he has a positive Corsi REL% every season since joining the Islanders in 2009. He was traded from New York to Buffalo after playing 11 games in 2013 with a -2.1, but bounced back in Buffalo for a 3.5 Corsi REL%. He had a cup of coffee in Minnesota with a 4.1 Corsi REL% in 20 games, finishing with a 2.3 on the season. Moulson came back to Buffalo thereafter.
Defender Rasmus Ristolainen led the team in shifts (30) and came in at 22:04 on the ice, five seconds behind leader Tyler Ennis. Ristolainen is getting a lot of ice time as a development move, and it’s starting to pay off – he’s taken 47 shots in 437 minutes over 18 games, when in 2013-14 he took a total of 52 in 650 minutes and 34 games. Ristolainen’s focus on playing scoring defense doesn’t appear to be paying off, though – even as he’s taking more shots, it appears from the statistics that he’s playing weaker defense. He’s taking more but allowing more, as well; although his Corsi For% is rising, it’s still weak (43.9%), and more shots are allowed to the defense while he’s on ice than while he’s off ice (reflected in his -9.0 Corsi REL%).

Linus Ullmark’s minion-themed mask
Linus Ullmark performed well, allowing 2 goals on 28 shots; the Sabres scored once on 26. Ullmark is 4-3, including a difficult November 5 loss to the Lightning. For a rookie, Ullmark’s 2.39 goals against average is solid – it’s better than Chad Johnson‘s 2.67, and Ullmark has a positive goals saved above average; it remains to be seen whether he’ll maintain his relatively high level of performance. So far, that single period against the Lightning seems to be a deviation. Johnson’s been much more variant. From a development perspective, I like seeing Linus start.
Both Buffalo and Dallas are idle tonight. The Sabres’ next game will be on the 19th at St. Louis.
Evaluating Hockey Analytics (and bonus luck numbers through November 15, 2015) November 16, 2015
Posted by tomflesher in Economics, Hockey, Sports.Tags: Corsi, Fenwick, Hockey analytics, NHL, Pythagorean expectation, Pythagorean luck, Sabres
add a comment
The Buffalo Sabres have been having a weird season. They’ve been outshot and won, they’ve outshot their opponents and lost, and (aside
from starting goalie Chad Johnson) their ice time leader, defenseman Rasmus Ristolainen, is bringing up the rear in relative Corsi and Fenwick stats. Ristolainen has a nasty -9.5 Corsi Rel, while fellow defenders Jake McCabe, Mark Pysyk, and Mike Weber have 8.5, 9.1, and 13.5, respectively. Ristolainen is averaging over 24 minutes a game, with the other three down by six to eight minutes each. What’s more, Ristolainen appears to be pulling his weight – he’s made 45 shots, second only to center Jack Eichel, and has 4 goals with an 8.9 shooting percentage. Ristolainen has 11 points (second only to Ryan O’Reilly with 14) but is tied with Tyler Ennis for the team’s worst +/- at -6. See? Weird year so far.
A lot of that is small sample size, of course. The Sabres are only 17 games into the 82-game season. They are, however, looking awfully lucky so far. Just how lucky? Let’s find out using the same Pythagorean metric that shows up in baseball.
Since Corsi and Fenwick both measure attempts to shoot, they’re noisier than goals. I was curious how much noisier, so I fired up R using the 2014 data and decided to update my post from earlier this year about the optimal Pythagorean exponent for the NHL. In it, I set up three minimization problems, all of them estimating winning percentage (and counting overtime losses as losses – the exponent changes only slightly if you estimate points-percentage instead of wins). Those three problems each minimized the sum of squares, using the Pythagorean formulas. The first used the traditional method of estimating goals and goals against; the second used Corsi For and Corsi Against; the third used Fenwick For and Fenwick Against.
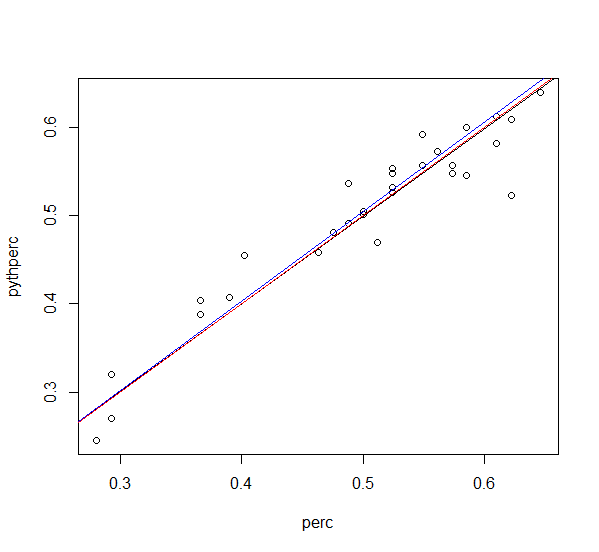
Pythagorean 2.11 in black, Corsi 1.445 in blue, and Fenwick 1.88 in red.
The Goals For/Goals Against form (

The Corsi For/Corsi Against form returns an optimal x of 1.445, but the residual sum of squares ballooned to .24. That means on average the squared error is almost ten times as great – you get a pretty good predictor, but with much more “noise.”
Right in the middle, the Fenwick form yields an optimal x of 1.877, with a residual squared error of .203. It’s a better predictor of wins and losses than the Corsi version, but it’s still not as good a predictor of wins as the simple Goals For/Goals Against form.
Above, I’ve graphed each team’s winning percentage against the Pythagorean (Goals For/Goals Against form), as well as all three trendlines: note that the black Goals line and the red Fenwick line are extremely close, while the blue Corsi line is a bit higher up. Two conclusions can be drawn:
- The Fenwick line is a better predictor than the Corsi line, but the Corsi line appears to bias expected percentage upward. That is, it overestimates the imact of each shot more than goals and Fenwick do.
- Since the Fenwick line is a better predictor, that indicates that Corsi’s inclusion of blocked shots probably does just add noise. Blocked shots are, at least according to this model, of limited predictive value.
Through November 15, Corsi For % had a correlation of .11 with points and .125 with winning percentage; Fenwick For % had correlations of .17 and .19, respectively. Blocked shots had negative correlations in both cases.
Pythagorean luck is defined as the number of wins above expectation. Behind the jump are the numbers, through November 15, demonstrating which teams are lucky and which aren’t.
What is the Corsi statistic? (And why is there a Fenwick number?) November 16, 2015
Posted by tomflesher in Hockey, Sports.Tags: Corsi, corsi statistic, evergreen, Fenwick, fenwick number, Hockey analytics, NHL
2 comments
Growing up in Buffalo, I was surrounded by hockey, whether it was watching the Sabres or heading to the rink to watch my brother play defense as a bantam or high schooler. During those years, my father, who could barely skate, often served as a volunteer coach for my brother’s teams. Like Malcolm Gladwell’s story of Vivek Ranadivé leading his “little blonde girls” to success using out-of-the-box basketball coaching, my father felt he was bringing an outsider’s perspective to the game by emphasizing a simple philosophy: own the puck.
This is easier said than done, of course, and when a group of squirts, peewees, or bantams head out onto the ice they need to apply some serious skill in order to “own the puck.” Overall, though, the point of owning that puck is to put it into the net. So, logically, the more a team controls the puck, the more likely it is to control the game.
It’s possible, of course, for a team to take many more shots and still lose, but the Corsi stat is meant to measure overall control. As such, it includes all attempted shots, so Corsi, as such, is defined as Shots + Attempted Shots – Shots Against – Attempted Shots Against. This gives you a simple differential in shots.
You’ll also see the following stats:
- Corsi For: Shots + Attempted Shots by the team, making it possible to isolate whether a team is making too few shots or allowing too many
- Corsi Against: Shots + Attempted Shots by the opposing team
- Corsi For Percentage (CF%): 100*Corsi For/(Corsi For + Corsi Against), giving a ratio rather than a simple differential. This measures what percentage of shots and shot attempts a team makes compared to its opponents. A CF% above 50% means a team attempts more shots than its opponent.
- Corsi On: A team’s Corsi while a particular player is on the ice scaled up to 60 minutes of ice time, effectively measuring whether the player’s Corsi is as good as, better than, or worse than the team’s as a whole. A Corsi ON greater than the team’s means the player contributes proportionally more to the team than ice time would indicate.
- Corsi Relative (Corsi REL): Corsi On – Corsi Off, showing whether a team performs better or worse with a player on the ice. If Corsi REL is positive, the team does a better job with the player on the ice.
Corsi was named after a Buffalo Sabres goaltending coach. Bob McKenzie of TSN shared the story of the Corsi number in 2014. Financial analyst Tim Barnes, writing under the pseudonym Vic Ferrari, heard Sabres GM Darcy Regier discussing shot attempts and save percentage as a goalie metric, but Ferrari didn’t care for the name “Regier Number” or “Ruff Number” (for Sabres coach Lindy Ruff). After browsing photos of the Sabres staff, Ferrari settled on Jim Corsi (above) as the eponym for the statistic. Interestingly, Corsi actually did come up with the idea and planted it in Regier’s head.
A similar stat, the Fenwick, simply discounts blocked shots since blocking shots is a skill.
Bills Thursday Night Football Recap: When in doubt, punt. November 13, 2015
Posted by tomflesher in Football, Sports.Tags: Bills, Jets, NFL wildcard
add a comment
Let’s not mince words – the Bills did not put on a great performance last night. Teams don’t usually punt 8 times in a winning effort, nor do they usually give up 26 yards in sacks or fail to convert a single time on fourth down. In fact, the Jets outdid the Bills in just about every category: more first downs, more yards passing, more total yards, and fewer penalties. Still, when it came down to scoring, the Bills got it done; although the Jets’ Randy Bullock scored first with an anemic 29-yard field goal, and the Bills’ Dan Carpenter missed his first extra point, the Bills controlled the middle of the game with 22 straight points from 5:47 of the second to the Jets’ first touchdown at 4:39 of the third.
Rex Ryan’s questionable use of a challenge flag early in the game to try (and fail) to get a ball re-spotted didn’t hurt as much as one would have expected, nor did the fact that he had used his third timeout by 10:46 of the fourth.
Ryan’s use of punter Colton Schmidt was also head-scratching at times. I’m well aware that Ryan is a defensive-minded coach, and a strengths-based leadership model demands that he continue doing what he does well. However, five of Colton’s nine punt attempts came with three or fewer yards to go; in fact, the Bills didn’t go for it at all on fourth down, with the only credited attempt being Schmidt’s bobble of the long snap and subsequent fumble recovery. Schmidt has never thrown or rushed, but I was dying for one of those 4th and short punt calls to be a fake and just send Schmidt scrambling for the first down. In a 22-17 game with 0:35 left in regulation, bringing Schmidt out to punt from the Buffalo 42 with 3 to go was a confusing decision that I was sure would result in a fake for the first down. Instead, a Garrett Sanderson holding penalty gave the Jets great field position anyway, and it was only Bacarri Rambo‘s interception of Ryan Fitzpatrick that gave the Bills the chance to kneel down.
This was a different Jets team – rather than relying on their kicking game, the Bills were able to keep the Jets deep in their own zone and prevent them from kicking the ball. By the time the Jets were able to get into field goal position again, they were behind 22-3 and needed to go for it at every opportunity.
The Bills won’t gain any momentum from this win – their next game will be on the 23rd for Monday Night Football at New England. The Patriots enter this weekend 8-0 and will take on a 5-4 Giants team in New Jersey. The Bills lost to the Patriots 40-32 at home in week 2, and this will be a tough game for them.
The Jets will head to Houston on the 22nd to face a Texans team that enters this weekend 3-5 against the 8-0 Bengals. Since the Bills’ wild card hopes are dependent on overtaking the Jets, week 11 will be a challenge: hopefully the Texans can rise up and the Bills can tighten that margin against the Patriots, but I’ll settle for 1 of 2.
Thursday Night Bills Preview for November 12, 2015 November 12, 2015
Posted by tomflesher in Football, Sports.Tags: Bills, football, Jets
add a comment

Randy Bullock, during happier times
Tonight, the Bills take the field on CBS in a crucial division game. The Jets (5-3) are currently the #1 wildcard in the AFC, while the Bills (4-4) are one slot behind them, leading the also-rans behind the #2 wildcard Steelers. It’s …. not inconceivable that the Bills could take the AFC East, but it would require them to overtake the 8-0 Patriots; much easier to just knock out the Jets.
In 8 games, the Jets have an overall score of 200-162 for a point differential of 38 and an average margin of victory of 4.8 points. (Pro Football Reference uses ‘margin of victory’ as differential/games, so toting up just the victories would give a larger number.) The Bills, meanwhile, have outscored their opponents 209-190, for a point differential of 19 and a margin of victory of 2.4 points. The Bills are 10th in the NFL for points scored, but as far as the AFC, no team with a record above .500 has allowed more points. (Only the Giants have allowed more points and have a winning record; the Falcons are 6-3 and match the Bills’ 190 points exactly. Each of those teams has played one more game than the Bills.)
One recent development that leans strongly in favor of the Bills is the loss of kicker Nick Folk. 25-year-old punter Ryan Quigley kicked four extra points, but he’s never so much as attempted a field goal. The Jets signed freely available talent Randy Bullock, who was waived by Houston after missing 2 of 5 extra point attempts and missing a key field goal in the second quarter against Tampa Bay. Though the Texans won the game, he missed that kick when they were down 9-7 with 1:35 left in the half; that had to be demoralizing.
Folk wasn’t exactly lights out either – he’d missed field goals of 40, 48, and 49 yards this season. The Jets have been quite reliant on their kicking game, though – 48 of their 200 points have come from field goals, and 19 from extra point tries. The Bills, in contrast, have made 22 of 23 extra point attempts and 9 of 11 field goals, having scored fewer points off kicker Dan Carpenter and more points overall than the Jets. The Bills have 11 rushing touchdowns and 13 receiving, as opposed to the Jets’ 8 rushing TDs and 15 receiving.
If the Bills’ defense can take advantage of the loss of a reliable kicker and force the Jets to keep the ball on the ground, this game is very winnable.
Chad Johnson saves the day – or at least helps a little November 11, 2015
Posted by tomflesher in Hockey, Sports.Tags: Chad Johnson, hockey, hockey-reference.com, Lightning, Sabres
add a comment
The Sabres (7-8-0) picked off the Lightning (7-8-2) last night in Tampa Bay, scoring four goals including one empty-netter by Rasmus Ristolainen with an assist from goalie Chad Johnson. The lanky Albertan started his ninth game of the year and pulled his 2.47 goals against average down with a one-goal complete game. Ristolainen has 3 points and a -2 plus/minus over his last five games, so the empty-net goal was a nice lift for him.
The Lightning outshot the Sabres 31-26, so Johnson’s performance was quite important. In the 2014 season, shots had about a .50 correlation with points and a slightly smaller (.49993) correlation with wins. A quick regression analysis shows that shots on goal have a statistically significant effect on both wins and points: one shot corresponds to about .023 wins and about .045 points, both significant at p < .01. Since the Lightning outshot the Sabres last night, there’s a reason that Johnson’s ‘miraculous’ saves were so key.
Quickie – Jeurys Familia’s warmup song October 19, 2015
Posted by tomflesher in Baseball, Sports.Tags: Jeurys Familia, NLCS
add a comment
Every time I’m at the park, I hear people asking what Jeurys Familia‘s warmup song is. Jeurys jogs out to Don Omar’s Danza Kuduro, which was covered by Lucenzo and Pitbull in English as “Throw Your Hands Up.”
This page from Happy Hour Spanish seems to be a solid translation of the lyrics.
Once he reaches the mound, Jeurys warms up to Lenny Kravitz’ “Are You Gonna Go My Way.”
Though Jeurys allowed his first hit of the postseason last night, he’s got four saves in 6 1/3 innings pitched. (He saved games 1 and 5 of the NLDS as well as game 1 of the NLCS; Familia definitely saved last night’s game, coming into a 4-1 game and pitching a scoreless inning.)
It was nice to see Tyler Clippard from the pen, since he hadn’t pitched since October 13; Addison Reed hadn’t pitched since the 12th. Jonathon Niese made a crucial one-out appearance and has a 27.00 K9 this postseason. It’s awesome that Bartolo Colon is nailing it in his relief role, but fantastic that the deep bullpen is still playing its role.
Five Mets To Keep Warm, and Run Scoring Into The Postseason October 5, 2015
Posted by tomflesher in Baseball, Sports.Tags: dodgers. NLDS, Mets
add a comment
Catcher Anthony Recker, infielder Eric Campbell, outfielder Eric Young, Jr., and pitchers Logan Verrett and Bobby Parnell will head to Port St Lucie for the fall instructional league, says ESPN. Kirk Nieuwenhuis will go to LA or to Port St Lucie, depending on whether Juan Uribe is healthy. That spot will likely be solely for pinch hitting, since Nieuwenhuis and Uribe aren’t interchangeable hitters at all.
Bartolo Colon and Jonathon Niese pitched from the bullpen in what appeared to be heavily planned outings.
It’s alarming that the Mets have scored only 2 runs in their last 4 games. However, they also scored 46 in their last 10; which of those figures tells us more about the postseason? Frankly, neither.
Looking at least year’s NLDS and NLCS, the correlations are extremely weak: runs scored over the last 10 games of the season predicted about 8% of runs scored in the NLDS, with the strongest explanatory power coming at 3 games (12.4%), closely followed by 8 games (12.3%). This is only based on last year’s numbers, but the correlations are mostly noise.
Even a simple model based on runs scored doesn’t work for last year – the Giants defeated the Nationals, who outscored them, and the Cardinals, who didn’t.
This year’s Mets have scored 683 runs and allowed 613. The Dodgers scored 667 and allowed 595. In their 7 games this year, the Mets won 4, and outscored them 33-19. The Mets were 2-2 in Citi Field and 2-1 in Dodger Stadium.
Mets Home Field Magic Number is 3, Because Time Is Running Out October 2, 2015
Posted by tomflesher in Baseball, Sports.Tags: home field, home field advantage, Mets, Nationals, preview
add a comment
If you do the math, 163 – Mets Wins – Dodgers Losses, you’ll end up with a magic number of 4 wins by the Mets and losses by the Dodgers to clinch home field for the National League Division Series. Both teams are 89-70, so each team going 3-3 would result in a tie. Since the Mets own the tiebreaker, though, the Mets don’t have to beat the Dodgers, just tie them.
The Mets enter a the last three games of the series tonight with Noah Syndergaard facing off against Gio Gonzalez. Gio has seen a steady rise in his ERA since moving to the Nationals in 2011 and is currently 11-8. Gio also reliably hits one double and home run per year; he’s a career .088 hitter and has checked off the 2B box but not the home run box so far.
The Mets have won their last six games against Washington. Syndergaard has a win and a no decision in a team loss to the Nationals this year; Gonzalez is 2-0 with a losing no decision against the Mets. The Nationals were 2-3, but Gonzalez was 2-1, in September; Gio put up a 2.89 ERA in September.
Yesterday’s bullpen game was ugly, but only offensively. Losing pitcher Sean Gilmartin pitched 5 innings and gave up 2 runs. Tim Stauffer gave up one hit in two innings of relief, in a nice surprise. Dario Alvarez gave up a home run to Andres Blanco, but Jeurys Familia struck out Aaron Altherr to end the game. Kevin Plawecki took the only walk for New York.
Against the Nationals in New York, Terry Collins is likely to start his usuals who sat during yesterday’s noon game. More offense is likely, and with the bullpen’s B team putting together a quality game, Syndergaard supported by Jonathon Niese, Tyler Clippard, and Addison Reed should be able to hold Gio homerless.
