I Still Like Ike April 27, 2015
Posted by tomflesher in Baseball.Tags: Buster Posey, Ike Davis, position players pitching
1 comment so far
No, not because of his .345 batting average or .405 OBP, but because of his 0.00 ERA.
The whole time Ike Davis was a Met, I would shout at the TV every time Terry Collins put in a tired reliever in a laugher that Ike needed to pitch. Ike was, after all, a starter in his freshman year at Arizona State, cobbling together 47.2 innings in 12 starts and 2 relief appearances for a 7.42 ERA. He got better, though – he spent most of his sophomore year in the outfield but still managed to make one start and six relief appearances, totalling 6.2 innings and a 1.34 ERA. In his junior year, Ike pitched in 16 games and 24 innings, going 4-1 with 4 saves and a 2.25 ERA. Ike was not a bad hurler. Buster Posey, of course, showed him up – while playing 68 games at catcher in 2007-08, Buster also made 9 relief appearances and collected 6 saves with a 1.17 ERA.
It was only natural that the A’s turned to Ike to pitch the ninth inning of a 14-1 blowout on April 21, but Ike pitched a perfect inning on 9 pitches. No runs, no hits, no errors, no walks. (No strikeouts, either….) It’s a shame I waited through all those games and Ike finally pitched on the other side of the country.
What does a long game do to teams? April 13, 2015
Posted by tomflesher in Baseball.Tags: extra innings, file drawer, linear model, linear regression, Red Sox, Yankees
add a comment
Friday, the Red Sox took a 19-inning contest from the Yankees. Both teams have the unfortunate circumstance of finishing a game around 2:15 A.M. and having to be back on the field at 1:05 PM. Everyone, including the announcers, discussed how tired the teams would be; in particular, first baseman Mark Teixeira spent a long night on the bag to keep backup first baseman and apparent emergency pitcher Garrett Jones fresh, leading Alex Rodriguez to make his first career appearance at first base on Saturday.
Teixeira wasn’t the only player to sit out the next day – center fielders Jacoby Ellsbury and Mookie Betts, catchers Brian McCann and Sandy Leon, and most of the bullpen all sat out, among others. The Yankees called up pitcher Matt Tracy for a cup of coffee and sent Chasen Shreve down, then swapped Tracy back down to Scranton for Kyle Davies. Boston activated starter Joe Kelly from the disabled list, sending winning pitcher Steven Wright down to make room. Shreve and Wright each had solid outings, with Wright pitching five innings with 2 runs and Shreve pitching 3 1/3 scoreless.
All those moves provide some explanation for a surprising result. Interested in what the effect of these long games are, I dug up all of the games from 2014 that lasted 14 innings or more. In a quick and dirty data set, I traced the scores for each team in their next games along with the number of outs pitched and the length in minutes of the game.
I fitted two linear models and two log models: two each with the next game’s runs as the dependent variable and two each with the difference in runs (next game’s runs – long game’s runs) as the dependent variable. Each used the length of the game in minutes, the number of outs, the average runs scored by the team during 2014, and an indicator variable for the presence of a designated hitter in each game. For each dependent variable, I modeled all variables in a linear form once and the natural log of outs and the natural log of the length of the game once.
With runs scored as the dependent variable, nothing was significant. That is, no variable correlated strongly with an increase or decrease in the number of runs scored.
With a run difference model, the length of the game in minutes became marginally significant. For the linear model, extending the length of the game by one minute lowers the difference in runs by about .043 runs – that is, normalizing for the number of runs scored the previous day, extending the game by one minute lowered the runs the next day by about .043. In the semilog model, extending the game by about 1% lowered the run difference by about 14; this was offset by an extremely high intercept term. This is a very high semielasticity, and both coefficients had p-values between .01 and .015. Nothing else was even close.
With all of the usual caveats about statistical analysis, this shows that teams are actually pretty good at bouncing back from long games, either due to the fact that most of the time they’re playing the same team (so teams are equally fatigued) or due to smart roster moves. Either way, it’s a surprise.
Not just offense – consistent offense. April 9, 2015
Posted by tomflesher in Baseball.Tags: 89 to go, Jacob deGrom, Mets
add a comment
Jacob deGrom pitched a quality start last night and got almost no run support.
Now, that’s not unusual. Last year, 2546 teams had their starter pitch 5 or more innings and allow two earned runs or fewer; 781 of those teams lost, for a winning percentage of around 69%. It’s not unusual for the Mets, either; they had 84 such games last year, including 16 from Bartolo Colon (14-1 in those games), 15 from Jon Niese (4-4), 19 from Zack Wheeler (11-2), and 13 from deGrom (9-1). The Mets were right in the middle for all of this – the median across MLB was 85 games and 61 wins in those games. Washington had the most games (101) and the most wins (79), along with the highest percentage of wins coming in 5-inning starts with 2 earned runs or fewer from the starter (82.2%).
Take note, though, of how disproportionate the wins were. Colon won all but 2 of his solid starts, with the Mets averaging 6.4 runs of support; Jon Niese only got 8 decisions, four of them losses, despite having almost as many games as Colon. Behind Niese, the Mets scored only 2.6 runs per game. deGrom had about 4.2 runs per game behind him and won 9 games; Wheeler had six more games with the same 4.2 run support average, but only got two more wins than deGrom in those games.
deGrom maintained last year’s high standards in this year’s first start, and the Mets provided very little run support; even deGrom didn’t support himself very well, shaving almost 40 batting-average points to hit only .178 in these starts compared with .217 in other starts.
Given, the Nationals are coming off a fantastic year as the best team in the National League’s regular season, so we can handle a 2-1 loss early in the season, but the offense needs to be more consistent if we’re going to take a rotation full of talent and turn it into a 90-win season.
It was the best of pitching; it was the worst of pitching. April 8, 2015
Posted by tomflesher in Baseball.Tags: Madison Bumgarner, Mat Latos, pitching
add a comment
I’ll be honest. This was scheduled to be a ridiculous gushing post about Madison Bumgarner completing a totally meaningless milestone. After finishing the final game of the World Series and earning a save1, he pitched seven innings to open the season for the Giants this season. That means Madison threw twelve consecutive innings, which sounded pretty impressive.
Unfortunately for Madison, the 2003 version of Josh Beckett did it better. He pitched a complete game to clinch the World Series for Florida and then opened the 2004 season with seven innings of one-run ball.Fortunately, Mat Latos bravely crumbled during last night’s game to provide the sports blogging community with material. Mat was knocked out of the box after only two outs, having given up a respectable seven runs before getting the hook. According to Baseball-Reference, no pitcher has lasted less than one full inning on opening day since 1982.
Latos is, however, in good company with his season-starting ERA of 94.50. Jose Contreras started on Opening Day for Chicago in 2007 and lasted only one inning, giving up 7 runs; Carl Pavano did the same in 2009 for Cleveland, giving up 9 runs in the process. Both salvaged their seasons respectably, but – and this is my Mets homer bias coming out – let’s hope Latos is remarkably consistent this year.
—
1 This was the right call by the official scorer, but I really wish he’d declared Jeremy Affeldt “ineffective in a brief appearance” to give Mad Bum the win. Yes, I can call 2 1/3 innings of one-hit, no-run ball during which the Giants took the lead they never relinquished both “ineffective” and “brief,” compared to Bumgarner’s five-inning save.
Kirk’s Big Spring March 20, 2015
Posted by tomflesher in Baseball, Economics.Tags: BABIP, KBB, Kirk Nieuwenhuis, Spring training
add a comment
Kirk Nieuwenhuis is having an incredible spring. All the usual caveats are in play – it’s spring training, so the stats are useless – but Kirk’s production has been exceptional. His slash line is .469/.553/.625 on 38 plate appearances. Let’s hit some sanity checks on Kirk’s production.
First of all, his BAbip is off the charts. This spring, Kirk’s batting average on balls in play is .536, which is ridiculously high. Kirk won’t be able to maintain that into the season. If he’s still got a .536 OBP by the trade deadline, I’ll eat my hat and post the video. Kirk’s BAbip has been pretty streaky, though. During his rough April, Kirk had a .300 BAbip, about the league average over the season; after coming back up in late June, he had a .377 BAbip over the remainder of the season, broken up as .625 over five June games with 11 at-bats, .267 over 28 at-bats in July, .400 over 23 August at-bats, and .348 over 32 at-bats in September.
From 2012 to 2013, Kirk’s BAbip dropped from about .379 to .246, and then shot back up to .370 in 2014. Using those numbers and taking first differences, then using the ratio of differences, that means we’d expect Kirk’s BAbip to drop to about .254 this season. Nonetheless, Kirk’s platoon splits are huge – against right-handed pitchers, from 2014, he’s got a .040/.050/.283 split (although he only made 9 at-bats and 10 plate appearances against left-handed pitchers). Though Kirk’s splits aren’t readily available, it’s possible that his big spring is residual of facing mostly right-handers.
In the spring, Kirk’s BAbip denominator (AB – HR – K – SF) is 28 and the numerator (H – HR) is 15. If we take Kirk’s previous-year .377 BAbip, over 28 trials we’d expect 15 or more successes to occur about 2.86% of the time. That’s just barely within the bounds of statistical significance (which would indicate we’d expect Kirk to hit between 6 and 15 times about 95% of the time), and well outside if we assume Kirk has a true mean of .254 (which would put our confidence interval at around 3-11 successes in 28 trials).
Second, take a look at Kirk’s K/BB ratio. Kirk has typically had a strikeout-to-walk ratio above 1; in 2013, he struck out about 2.67 times for every time he walked, and in 2014 it was about 2.44 strikeouts per walk. Over this small spring sample size, Kirk’s K/BB has actually dipped below 1, at 4/6 (or .667). Assuming Kirk walked 6 times anyway, using a conservative 2:1 K/BB ratio would turn 8 of Kirk’s hits into strikeouts. That would make Kirk’s BAbip tighten up to .350. Still strong, but not the obscene .536 we’ve seen. Even if we convert one walk to a strikeout and maintain a 2 K/BB, that would leave Kirk at .409, a very respectable spring.
Kirk’s numbers have been shocking, and of course he’s out of options, so he’s extremely likely to make the team. As a left-handed bat, he’d be a strong everyday player if the outfield weren’t so crowded, but with Michael Cuddyer and Juan Lagares in the mix already along with lefties Curtis Granderson and Matt den Dekker, it’s going to be tough to find Kirk a clean platoon spot.
A Pythagorean Exponent for the NHL March 17, 2015
Posted by tomflesher in Sports.Tags: hockey, luck, NHL, parameter identification, Pythagorean expectation, Sabres
4 comments
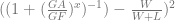
A Pythagorean expectation is a statistic used to measure how many wins a team should expect, based on how many points they score and how many they allow. The name ‘Pythagorean’ comes from the Pythagorean theorem, which measures the distance between the two short sides of a right triangle (the hypotenuse); the name reflects the fact that early baseball-centric versions assumed that Runs^2/(Runs^2 + Runs Allowed^2) should equal the winning percentage, borrowing the exponent of 2 from the familiar Pythagorean theorem (a^2 +b^2 =c^2).
The optimal exponent turned out not to be 2 in just about any sport; in baseball, for example, the optimal exponent is around 1.82. This is found by setting up a function – in the case of the National Hockey League, that formula would be 

Porting that exponent into the current season, there are a few surprises. First of all, the Anaheim Ducks have been lucky – almost six full wins worth of luck. It would hardly be surprising for them to tank the last few games of the season. Similarly, the Washington Capitals are on the precipice of the playoff race, but they’re over four games below their expected wins. With 11 games to go, there’s a good chance they can overtake the New York Islanders (who are 3.4 wins above expectation), and they’re likely to at least maintain their wild card status.
On the other end, somehow, the Buffalo Sabres are obscenely lucky. The worst team in the NHL today is actually 4 games better than its expectation. Full luck standings as of the end of March 16th are behind the cut.
What is BAbip? March 16, 2015
Posted by tomflesher in Baseball.Tags: BABIP, evergreen
3 comments
The first stat we all learned about as kids was the batting average, where you calculate what proportion of at-bats end with getting a hit. Then, of course, we start thinking about why there are weird exceptions – why doesn’t getting hit by a pitch count? Why don’t walks count? Why doesn’t advancing to first on catcher’s interference count? OBP, or on-base percentage, fixes that. (Well, maybe not the catcher’s interference part…)
Batting average has some interesting properties, though. It captures events that have unpredictable outcomes – when you walk, it’s basically impossible to be put out on your way to first. Ditto being hit by a pitch. Of course, BA does have some of those determined outcomes, too – home runs and strikeouts don’t have much dynamic nature to them, although you’ll occasionally see brilliant defense save a sure homer (a la Carl Crawford’s MVP performance in the or a sloppy catcher mishandle a third strike and forget to tag the batter. (I’m looking at you, Josh Paul.) Nonetheless, balls in play – balls that the batter makes contact with, forcing the defense to try to make a play – are a major source of variation in the game.
BAbip is measured as 
Since the ball is out of the pitcher’s control as soon as it leaves his hand, BAbip measures things that the pitcher isn’t responsible for – that is, it’s handy as a measure of pitching luck, or, teamwide, as a measure of defensive effectiveness. The NL team BAbip average was .299, and AL average BAbip was about .298.
Use Cases for BAbip:
– Evaluating hitting development. If a batter has had a stable BAbip for a while and his BAbip increases significantly, be suspicious! Particularly if his walk rate hasn’t increased, his home run rate hasn’t increased, and his strikeout rate hasn’t decreased, this might be a function of lucky hitting against bad or inefficient defenses. If the biggest part of an increase in production has been on balls in play, your hitter may not have actually improved. On the other hand, if you can see physical changes, or you have an explanation (e.g., went to AAA to work on his swing), you may see a more balanced improvement in OBP.
– Evaluating pitching luck. Most of the time, all the pitchers for the same team pitch in front of the same defense. Even with a personal catcher in the mix, expect most pitchers on a team to have similar batting averages on balls in play. If you have one pitcher whose BAbip is much higher than the rest of the pitchers, he may be pitching against bad luck. With that in mind, you can expect that pitcher to improve going forward.
– Comparing defenses. In 2014, Oakland had a .274 BAbip and allowed 572 runs – the best in the American league in BAbip and 18 runs behind Seattle – while Minnesota had a .317 BAbip and allowed 777 runs, the worst in both categories in the league. Defensive efficiency (a measure of 1 – BAbip) tracks closely with runs allowed. BAbip can operate as a quick and dirty check on how well a defense is performing behind a pitcher.
Spitballing: Pi Day March 14, 2015
Posted by tomflesher in Baseball.Tags: Pi Day
add a comment
Happy Pi Day! In honor of Pi Day, I’d like to share a few leaderboards.

Stephen Strasburg. Photo by Keith Allison, used under Creative Commons license
First, league median BAbip was .297. Here are four pitchers who got a little less lucky than the average, since their BAbip was .314:
| Player | Year | Tm | |
|---|---|---|---|
| Randall Delgado | .314 | 2014 | ARI |
| Erik Bedard | .314 | 2014 | TBR |
| Aaron Barrett | .314 | 2014 | WSN |
| Chad Qualls | .314 | 2014 | HOU |
| Louis Coleman | .314 | 2014 | KCR |
Then, let’s follow up with the other side: the unlucky hitters who would only get on base 3.14 out of every 10 plate appearances:
| Player | HR | Year | Tm | Pos | |
|---|---|---|---|---|---|
| Alejandro De Aza | 8 | .314 | 2014 | TOT | *78/HD9 |
| Michael Bourn | 3 | .314 | 2014 | CLE | *8/H |
| Elvis Andrus | 2 | .314 | 2014 | TEX | *6/DH |
| Jose Tabata | 0 | .314 | 2014 | PIT | *H97/8D |
In addition, let’s take a look at the two hitters from 2014 who hit the ball 3.14 out of every 10 at-bats:
| Player | Year | Age | Tm | |
|---|---|---|---|---|
| Robinson Cano | .314 | 2013 | 30 | NYY |
| Andrew McCutchen | .314 | 2014 | 27 | PIT |
| Robinson Cano | .314 | 2014 | 31 | SEA |
Yeah, Robbie Cano managed to hit Pi in 2013 AND 2014. The boy must love his geometry.
Our last mention: This year’s Pi Day mascot is Stephen Strasburg, who had an ERA of 3.14. The league-average ERA for pitchers who started 60% of their games was 3.86, so Stephen was in pretty good shape.
Spring Training: Still Useless For Predicting Stats March 12, 2015
Posted by tomflesher in Baseball.Tags: Spring training
add a comment
A few days ago, I watched a Mets-Marlins spring training game that ended in a brutal 13-2 loss. It had all of the usual spring training fun – Zack Wheeler working too far inside and hitting two batters, Michael Cuddyer starting at first with Lucas Duda out, and Don Kelly’s hustle allowing him to draw a walk, steal a base, and score on a single, even while Cliff Floyd was snickering about how Jim Leyland kept him on the roster for no apparent reason in the playoffs.
(Yeah, I know, Kelly’s a Marlin. Shut up.)
During the game, I tweeted out a link to a file-drawer post from last year that indicated that there’s almost no correlation between spring performance and regular-season performance. I thought I’d run a quick update on that, so I dug up the Mets’ individual performance in spring training and analyze it compared to the regular season.
There were 15 Mets who had 30 plate appearances in Spring Training and 100 plate appearances in the regular season. That’s a really small sample, so accuracywise we’d better keep our fingers crossed, but it’s enough data to spitball a little.
I ran four correlations on this – spring and regular season batting average, OBP, SLG, and OPS – and then created an additional stat to measure whether hitters changed hitting style from spring to the regular season. This was a quick and dirty attempt to measure whether hitters favored OBP or SLG, so I took the ratio (SLG/OPS) and reasoned that a power hitter will have a larger ratio and a singles hitter will have a smaller. I measured this correlation, too, to determine if there were big changes.
The results are unsurprising – the correlations are really low. Batting average correlates at around .019, and SLG at .305. OBP actually had a negative correlation, indicating that a high spring OBP may be a bad sign for the regular season. This is probably sampling error, due to the tiny number of observations, due almost entirely to Anthony Recker’s magical .426 spring and average regular season. That was about a -.25 correlation, which explains why OPS has a -.05 (near-zero) correlation – that big flip in OBP is going to offset the OPS correlation, too.
The strongest correlation was style – at about .619, it’s a pretty good indicator that if a hitter’s SLG is how he scores, he’ll maintain that hitting style throughout the season.
What is OPS? January 12, 2015
Posted by tomflesher in Baseball.Tags: evergreen, OBP, OPS, SLG, statistics
2 comments
Sabermetricians (which is what baseball stat-heads call ourselves to feel important) disregard batting average in favor of on-base percentage for a few reasons. The main one is that it really doesn’t matter to us whether a batter gets to first base through a gutsy drag bunt, an excuse-me grounder, a bloop single, a liner into the outfield, or a walk. In fact, we don’t even care if the batter got there through a judicious lean-in to take one for the team by accepting a hit-by-pitch. Batting average counts some of these trips to first, but not a base on balls or a hit batsman. It’s evident that plate discipline is a skill that results in higher returns for the team, and there’s a colorable argument that ability to be hit by a pitch is a skill. OBP is 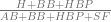
We also care a lot about how productive a batter is, and a productive batter is one who can clear the bases or advance without trouble. Sure, a plucky baserunner will swipe second base and score from second, or go first to third on a deep single. In an emergency, a light-hitting pitcher will just bunt him over. However, all of these involve an increased probability of an out, while a guy who can just hit a double, or a speedster who takes that double and turns it into a triple, will save his team a lot of trouble. Obviously, a guy who snags four bases by hitting a home run makes life a lot easier for his teammates. Slugging percentage measures how many bases, on average a player is worth every time he steps up to the plate and doesn’t walk or get hit by a pitch. Slugging percentage is 
OPS is just On-Base Percentage plus Slugging Percentage. It doesn’t lend itself to a useful interpretation – OPS isn’t, for example, the average number of bases per hit, or anything useful like that. It does, however, provide a quick and dirty way to compare different sorts of hitters. A runner who moves quickly may have a low OBP but a high SLG due to his ability to leg out an extra base and turn a single into a double or a double into a triple. A slow-moving runner who can only move station to station but who walks reliably will have a low SLG (unless he’s a home-run hitter) but a high OBP. An OPS of 1.000 or more is a difficult measure to meet, but it’s a reliable indicator of quality.
