The Jordan Lyles Show April 8, 2014
Posted by tomflesher in Baseball.Tags: Baseball, Jordan Lyles, Pitchers batting, Rockies, Troy Tulowitzki
add a comment
Jordan Lyles put up a great line for the Rockies against the White Sox last night. Lyles threw 6 2/3 for the Rockies, striking out four, walking two, and allowing one run (which didn’t come until the seventh inning). Although he was hooked for throwing a wild pitch while striking out Paul Konerko, allowing an RBI double to Alexei Ramirez, and then walking Tyler Flowers, Lyles had more than earned the extra slack that manager Walt Weiss gave him. Lyles hit one of the team’s three doubles (the others were hit by Troy Tulowitzki and Michael Cuddyer) as well as two singles of his own, including two runs batted in. That gives Lyles a pretty nice season line: 2-0, 3.86 ERA, .600/.667/.800.
It’s almost a shame to see Troy Tulowitzki‘s performance lost in the shuffle. Troy was 3 for 3 with a walk, a double, and a home run; late in the game he came out to allow Charlie Culberson some time in the field.
Though Lyles hasn’t shown this sort of consistency yet, last year marked Adam Wainwright matching his three-hit, 2-RBI feat twice. Micah Owings and Chan Ho Park have each had two 3-hit, 2-RBI games in a single season as well.
The Three-Inning Save is an Endangered Species April 7, 2014
Posted by tomflesher in Baseball.Tags: Baseball, Brad Hand, Marlins, saves, Tom Koehler
add a comment
Yesterday, Manny Parra pitched two perfect innings to pick up the save against the Mets. It was a natural save situation – the Reds were leading 2-1 and used their best reliever to maintain that lead. Usually, saves are only one inning, but two-inning saves aren’t unusual.
The save rule (Rule 10.19) does, however, allow for a less-common type of save:
- He is the finishing pitcher in a game won by his team;
- He is not the winning pitcher;
- He is credited with at least ⅓ of an inning pitched; and
- He satisfies one of the following conditions:
- He enters the game with a lead of no more than three runs and pitches for at least one inning
- He enters the game, regardless of the count, with the potential tying run either on base, at bat or on deck
- He pitches for at least three innings.
Brad Hand of Miami picked up that sort of save on April 4th, saving starter Tom Koehler‘s win in a rout of the Padres. It was Hand’s first career save; he’s in his fourth season with the Marlins and has been excellent from the bullpen, but this was his first save opportunity. It was also the first three-inning save of 2014.
The king of the three-inning save last year was Brett Anderson, then of Oakland and currently of Colorado. Anderson recorded three of the long saves – coincidentally his only three career saves. He’s starting for Colorado this year, so his days as long man are probably over. These long saves were more common in the past, when starters finished games far more often and specialized relievers weren’t used; the all-time leader for this type of save is Hoyt Wilhelm, who notched 53 of them between 1952 and 1971, often pitching four full innings. Bob Stanley, Dan Quisenberry, and Bill Campbell share the single-season record with 11 three-inning saves in 1982, 1983, and 1977, respectively. Since 2005, only Anderson and John Wasdin of the 2005 Texas Rangers have had three of them in a season. Don’t expect many more this year.
Cueto sits on bench, sobs April 6, 2014
Posted by tomflesher in Baseball.Tags: Baseball, bullpen, game score, Ike Davis, Johnny Cueto, Juan Lagares, Mets, Tough Losses
add a comment
Johnny Cueto is having a tough year so far. In yesterday’s game against the Mets, he pitched to a game score of 65, allowing two earned runs in seven innings; he left with a lead, followed quickly with a hold by Sam LeCure and a blown save by J.J. Hoover, who surrendered a pinch-hit grand slam to professional pinch hitter Ike Davis1. 65 is a solid game score; the sabermetric definition of a quality start is a pitcher who adds value to his team by pitching to a game score above 50. In his first start of the year, Cueto threw seven innings of three-hit ball and struck out eight, pitching to a 74 game score and surrendering only one run. Unfortunately, that day, Adam Wainwright threw seven innings of three-hit ball and struck out nine, pitching to a 76 game score and surrendering no runs. Neither bullpen surrendered much, and so Wainwright took the win and dealt Cueto one of the toughest losses we’re likely to see this year.
Let’s give the devil their due – although it’s been easy to criticize the Mets’ bullpen, Scott Rice and Carlos Torres combined for a perfect inning and two thirds yesterday, keeping the score close enough that Ike was able to knock in the winning home run.
Meanwhile, Juan Lagares‘ slugging percentage is still up at .765, and with 13 total bases on 21 plate appearances he’s averaging about .62 bases every time he steps to the plate. Lagares’ slide into second yesterday was important for Ike’s hit to be a grand slam; if he’d been out, Ruben Tejada could easily have grounded into a double play and kept Ike out of the batter’s box. Still, Tejada’s OBP is at .389, and if he can keep that up, a shortstop who gets on base almost eight out of every 20 plate appearances is a valuable person to have on your roster.
_______
1Davis’s first pinch-hit home run, and, according to Greg Prince via Twitter, the first come-from-behind walk-off grand slam in the history of the Mets.
From the File Drawer: Does Spring Training Predict Wins? March 18, 2014
Posted by tomflesher in Baseball.Tags: Baseball, file drawer, Spring training
1 comment so far
Nope.
It’s an idle curiosity, and more information is never a bad thing, but first, you need to establish whether there’s actually any information being generated. It would be useful, potentially, to have a sense of at least how the first few weeks of the season might go, so I decided to crunch some numbers to see whether I could torture the data far enough to get a good predictive measure. I grabbed the spring training and regular season stats from 2012 and 2013 and started at it.
First round.
Correlation! Correlations are useful. The correlation of spring winning percentage and regular-season winning percentage? A paltry .069. That’s not even worth looking at. This is going to be harder than I thought.
Second round.
Well, maybe if we try a Pythagorean expectation, we might get something useful. Let’s try the 2 exponent…. Hm. That correlation is even worse (.063). Well, maybe the 1.82 “true” exponent will help…. .065. This isn’t going to work very well.
Third round.
Okay. This is going to involve some functional-form assumptions if we really want to go all Mythbusters on the data’s ass and figure out something that works. First, let’s validate the Pythagorean expectation by running an optimization to minimize the sum of squared errors, with runratio = Runs Allowed/Runs Scored and perc = regular season winning percentage:
> min.RSS <- function(data,B) {with(data,sum((1/(1 + runratio^B) – perc)^2))}
> result<-optimize(min.RSS, c(0,10),data=data)
> result
$minimum
[1] 1.799245
$objective
[1] 0.04660422
That “$minimum” value means that the optimal value for B (the pythagorean exponent) is around 1.80 (to the nearest hundredth). The “$objective” value is the sum of squared errors. Let’s try the same thing with the Spring data:
> spring.RSS <- function(data,SprB) {with(data,sum((1/(1 + runratio.spr^SprB) – Sprperc)^2))}
> springresult<-optimize(spring.RSS, c(0,10),data=data)
> springresult
$minimum
[1] 2.243336
$objective
[1] 0.1253673
Alarmingly, even with the same amount of data, the sum of squared errors is almost triple the same measure for the regular-season data. The exponent is also pretty far off. Now for some cross-over: can we set up a model where the spring run ratio yields a useful measure of regular-season win percentage? Let’s try it out:
> cross.RSS <- function(data,crossB) {with(data,sum((1/(1 + runratio.spr^crossB) – perc)^2))}
> crossresult<-optimize(cross.RSS,c(0,10),data=data)
> crossresult
$minimum
[1] 0.08985465
$objective
[1] 0.3214856
> crossperc <- 1/(1 + runratio.spr^crossresult$minimum)
> cor(perc,crossperc)
[1] 0.05433157
.054, everybody! That’s the worst one yet!
Now, if anyone ever asks, go ahead and tell them that at least based on an afternoon of noodling around with R, spring training will not predict regular-season wins.
Just for the record, the correlation between the Pythagorean expectation and wins is enormous:
> pythperc<-1/(1 + runratio^result$minimum)
> cor(perc,pythperc)
[1] 0.9250366
Jim Thome, Revised July 14, 2011
Posted by tomflesher in Baseball.Tags: 600 home runs, Baseball, forecasting, Jim Thome
add a comment
In an earlier post, I predicted that if Jim Thome stayed healthy, he’d hit the 600 home run mark at some point in late July, with a loose prediction that he’d hit it around July 26 (the Twins’ 100th game). Since he got hurt, and since he’s been playing hurt for a while, it’s worth refiguring the date.
Thome needs five home runs.
This year, Thome has hit 6 home runs in 128 plate appearances for a rate of .046875 home runs per plate appearance, or one home run every 21 1/3 plate appearances. That’s down quite a bit from his career rate, which worked out to one home run every 13.5 plate appearances. Since his return, though, he’s hit 2 home runs in 34 plate appearances, or one every 17. If that represents his true production, then he’ll need about 5*17 = 85 plate appearances to hit five more home runs.
Since his return, Thome has averaged 2.8 plate appearances per game he played in, but he’s had two nights off. Per team game, that works out to 2.4 plate appearances. That means, roughly, he’ll need about 85/2.4 = 35.4 team games to hit those 5 home runs, or, to round it up, he’ll probably hit his 600th 35 games from now. That 35th game is team game #124, at home against the Yankees on August 18th. If he maintains his 2.4 plate appearances per team game and he produces at his career rate (every 13.5 plate appearances), he’ll need about 68 plate appearances, or 28 games and change. The 29th game is on Friday, August 12, in Cleveland. (Wouldn’t that be sweet for Thome?) If he continues hitting ever 21 1/3 plate appearances, that means he’ll need about 107 plate appearances, or about 44 games and change. The 45th game is August 27, at home against Detroit.
It’ll become easier to nail down, but there’s about a ten-day window where I’d lay my odds for Thome to hit #600. If I had to narrow it down to a week, I’d shoot for the six-game series that starts on the road at Detroit on August 15 and ends at home against the Yankees on August 21. That accounts for Thome’s depressed home run production but doesn’t penalize him for playing hurt the way that assuming his pre-injury rate would.
Home Field Advantage Again July 12, 2011
Posted by tomflesher in Baseball, Economics.Tags: attendance effects, Baseball, Giants, home field advantage, linear regression, probability, probit, statistics
add a comment
In an earlier post, I discussed the San Francisco Giants’ vaunted home field advantage and came to the conclusion that, while a home field advantage exists, it’s not related to the Giants scoring more runs at home than on the road. That was done with about 90 games’ worth of data. In order to come up with a more robust measure of home field advantage, I grabbed game-by-game data for the national league from the first half of the 2011 season and crunched some numbers.
I have two questions:
- Is there a statistically significant increase in winning probability while playing at home?
- Is that effect statistically distinct from any effect due to attendance?
- If it exists, does that effect differ from team to team? (I’ll attack this in a future post.)
Methodology: Using data with, among other things, per-game run totals, win-loss data, and attendance, I’ll run three regressions. The first will be a linear probability model of the form

where 

As such, I’ll also run a Probit model of the same equation to avoid problems caused by the simplicity of the linear probability model.
Finally, just as a sanity check, I’ll run the same regression, but for runs, instead of win probability. Since runs aren’t binary, I’ll use ordinary least squares, and also control for the possibility that games played in American League parks lead to higher run totals by controlling for the designated hitter:

Since runs are a factor in winning, I have the same expectations about the signs of the beta values as above.
Results:
Regression 1 (Linear Probability Model):

So, my prediction about the attendance betas was incorrect, but only because I failed to account for the squared terms. The effect from home attendance increases as we approach full attendance; the effect from road attendance decreases at about the same rate. There’s still a net positive effect.
Regression 2 (Probit Model):

Note that in both cases, there’s a statistically significant 
Finally, the regression on runs:
Regression 3 (Predicted Runs):
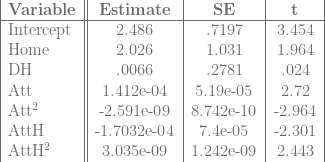
Again, with runs, there is a statistically significant effect from being at home, and a variety of possible attendance effects. For low attendance values, the Home effect is probably swamped by the negative attendance effect, but for high attendance games, the Home effect probably outweighs the attendance effect or the attendance effect becomes positive.
Again, the Home effect is statistically significant no matter which model we use, so at least in the National League, there is a noticeable home field advantage.
Padre Differential July 11, 2011
Posted by tomflesher in Baseball, Economics.Tags: Baseball, baseball-reference.com, linear regression, National League, Padre Differential, Padres, Phillies, runs allowed, runs scored, statistics
1 comment so far
I was all set to fire up the Choke Index again this year. Unfortunately, Derek Jeter foiled my plan by making his 3000th hit right on time, so I can’t get any mileage out of that. Perhaps Jim Thome will start choking around #600 – but, frankly, I hope not. Since Jeter had such a callous disregard for the World’s Worst Sports Blog’s material, I’m forced to make up a new statistic.
This actually plays into an earlier post I made, which was about home field advantage for the Giants. It started off as a very simple regression for National League teams to see if the Giants’ pattern – a negative effect on runs scored at home, no real effect from the DH – held across the league. Those results are interesting and hold with the pattern that we’ll see below – I’ll probably slice them into a later entry.
The first thing I wanted to do, though, was find team effects on runs scored. Basically, I want to know how many runs an average team of Greys will score, how many more runs they’ll score at home, how many more runs they’ll score on the road if they have a DH, and then how many more runs the Phillies, the Mets, or any other team will score above their total. I’m doing this by converting Baseball Reference’s schedules and results for each team through their last game on July 10 to a data file, adding dummy variables for each team, and then running a linear regression of runs scored by each team against dummy variables for playing at home, playing with a DH, and the team dummies. In equation form,

For technical reasons, I needed to leave a team out, and so I chose the team that had the most negative coefficient: the Padres. Basically, then, the 

That is, the Padre Differential shows whether a team’s per-game run differential is higher or lower than the Padres’.
The table below shows each team in the National League, sorted by Padre Differential. By definition, San Diego’s Padre Differential is zero. ‘Sig95’ represents whether or not the value is statistically significant at the 95% level.

Unsurprisingly, the Phillies – the best team in baseball – have the highest Padre Differential in the league, with over 1.3 runs on average better than the Padres. Houston, in the cellar of the NL Central, is the worst team in the league and is .8 runs worse than the Padres per game. Florida and Chicago are both worse than the Padres and are both close to (Florida, 43) or below (Chicago, 37) the Padres’ 40-win total.
June Wins Above Expectation July 1, 2011
Posted by tomflesher in Baseball, Economics.Tags: Baseball, baseball-reference.com, statistics, wins above expectation
add a comment
Even though I’ve conjectured that team-level wins above expectation are more or less random, I’ve seen a few searches coming in over the past few days looking for them. With that in mind, I constructed a table (with ample help from Baseball-Reference.com) of team wins, losses, Pythagorean expectations, wins above expectation, and Alpha.
Quick definitions:
- The Pythagorean Expectation (pyth%) is a tool that estimates what percentage of games a team should have won based on that team’s runs scored and runs allowed. Since it generates a percentage, Pythagorean Wins (pythW) are estimated by multiplying the Pythagorean expectation by the number of games a team has played.
- Wins Above Expectation (WAE) are wins in excess of the Pythagorean expected wins. It’s hypothesized by some (including, occasionally, me) that WAE represents an efficiency factor – that is, they represent wins in games that the team “shouldn’t” have won, earned through shrewd management or clutch play. It’s hypothesized by others (including, occasionally, me) that WAE represent luck.
- Alpha is a nearly useless statistic representing the percentage of wins that are wins above expectation. Basically, W-L% = pyth% + Alpha. It’s an accounting artifact that will be useful in a long time series to test persistence of wins above expectation.
The results are not at all interesting. The top teams in baseball – the Yankees, Red Sox, Phillies, and Braves – have either negative WAE (that is, wins below expectation) or positive WAE so small that they may as well be zero (about 2 wins in the Phillies’ case and half a win in the Braves’). The Phillies’ extra two wins are probably a mathematical distortion due to Roy Halladay‘s two tough losses and two no-decisions in quality starts compared with only two cheap wins (and both of those were in the high 40s for game score). In fact, Phildaelphia’s 66-run differential, compared with the Yankees’ 115, shows the difference between the two teams’ scoring habits. The Phillies have the luxury of relying on low run production (they’ve produced about 78% of the Yankees’ production) due to their fantastic pitching. On the other hand, the Yankees are struggling with a 3.53 starters’ ERA including Ivan Nova and AJ Burnett, both over 4.00, as full-time starters. The Phillies have three pitchers with 17 starts and an ERA under 3.00 (Halladay, Cliff Lee, and Cole Hamels) and Joe Blanton, who has an ERA of 5.50, has only started 6 games. Even with Blanton bloating it, the Phillies’ starer ERA is only 2.88.
That doesn’t, though, make the Yankees a badly-managed team. In fact, there’s an argument that the Yankees are MORE efficient because they’re leading their league, just as the Phillies are, with a much worse starting rotation, through constructing a team that can balance itself out.
That’s the problem with wins above expectation – they lend themselves to multiple interpretations that all seem equally valid.
Tables are behind the cut. (more…)
Is scoring different in the AL and the NL? May 31, 2011
Posted by tomflesher in Baseball, Economics.Tags: American League, Baseball, baseball-reference.com, bunts, Chow test, linear regression, National League, R, structural break
1 comment so far
The American League and the National League have one important difference. Specifically, the AL allows the use of a player known as the Designated Hitter, who does not play a position in the field, hits every time the pitcher would bat, and cannot be moved to a defensive position without forfeiting the right to use the DH. As a result, there are a couple of notable differences between the AL and the NL – in theory, there should be slightly more home runs and slightly fewer sacrifice bunts in the AL, since pitchers have to bat in the NL and they tend to be pretty poor hitters. How much can we quantify that difference? To answer that question, I decided to sample a ten-year period (2000 until 2009) from each league and run a linear regression of the form

Where runs are presumed to be a function of hits, doubles, triples, home runs, stolen bases, times caught stealing, walks, strikeouts, hit batsmen, bunts, and sacrifice flies. My expectations are:
- The sacrifice bunt coefficient should be smaller in the NL than in the AL – in the American League, bunting is used strategically, whereas NL teams are more likely to bunt whenever a pitcher appears, so in any randomly-chosen string of plate appearances, the chance that a bunt is the optimal strategy given an average hitter is much lower. (That is, pitchers bunt a lot, even when a normal hitter would swing away.) A smaller coefficient means each bunt produces fewer runs, on average.
- The strategy from league to league should be different, as measured by different coefficients for different factors from league to league. That is, the designated hitter rule causes different strategies to be used. I’ll use a technique called the Chow test to test that. That means I’ll run the linear model on all of MLB, then separately on the AL and the NL, and look at the size of the errors generated.
The results:
- In the AL, a sac bunt produces about .43 runs, on average, and that number is significant at the 95% level. In the NL, a bunt produces about .02 runs, and the number is not significantly different from saying that a bunt has no effect on run production.
- The Chow Test tells us at about a 90% confidence level that the process of producing runs in the AL is different than the process of producing runs in the NL. That is, in Major League Baseball, the designated hitter has a statistically significant effect on strategy. There’s structural break.
R code is behind the cut.
